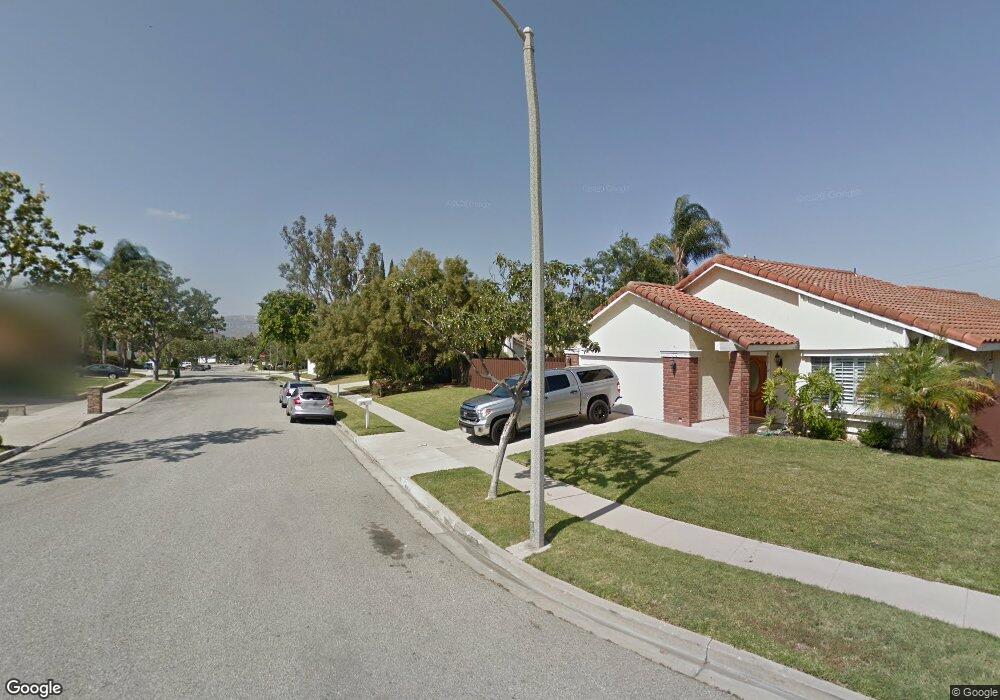
1568 Cayton Place Simi Valley, CA 93065
West Simi Valley NeighborhoodEstimated Value: $803,000 - $861,000
4
Beds
2
Baths
1,437
Sq Ft
$577/Sq Ft
Est. Value
About This Home
This home is located at 1568 Cayton Place, Simi Valley, CA 93065 and is currently estimated at $829,813, approximately $577 per square foot. 1568 Cayton Place is a home located in Ventura County with nearby schools including Madera Elementary School, Sinaloa Middle School, and Royal High School.
Ownership History
Date
Name
Owned For
Owner Type
Purchase Details
Closed on
May 19, 2015
Sold by
Hook Lynn F
Bought by
Hook Lynn
Current Estimated Value
Purchase Details
Closed on
Apr 22, 2002
Sold by
Hook Lynn F
Bought by
Hook Lynn F
Home Financials for this Owner
Home Financials are based on the most recent Mortgage that was taken out on this home.
Original Mortgage
$151,500
Outstanding Balance
$64,459
Interest Rate
7.18%
Estimated Equity
$765,354
Purchase Details
Closed on
Mar 1, 1999
Sold by
Hook Dennis A
Bought by
Hook Lynn F
Home Financials for this Owner
Home Financials are based on the most recent Mortgage that was taken out on this home.
Original Mortgage
$149,800
Interest Rate
6.91%
Mortgage Type
Stand Alone First
Purchase Details
Closed on
Feb 18, 1999
Sold by
Wells Craig R and Wells Julie A
Bought by
Hook Lynn F
Home Financials for this Owner
Home Financials are based on the most recent Mortgage that was taken out on this home.
Original Mortgage
$149,800
Interest Rate
6.91%
Mortgage Type
Stand Alone First
Purchase Details
Closed on
Jun 18, 1996
Sold by
Vanacker Lee P and Vanacker Brenda L
Bought by
Wells Craig R and Wells Julie A
Home Financials for this Owner
Home Financials are based on the most recent Mortgage that was taken out on this home.
Original Mortgage
$173,850
Interest Rate
8.11%
Create a Home Valuation Report for This Property
The Home Valuation Report is an in-depth analysis detailing your home's value as well as a comparison with similar homes in the area
Home Values in the Area
Average Home Value in this Area
Purchase History
| Date | Buyer | Sale Price | Title Company |
|---|---|---|---|
| Hook Lynn | -- | None Available | |
| Hook Lynn F | -- | American Title Co | |
| Hook Lynn F | -- | Fidelity National Title | |
| Hook Lynn F | $214,000 | Fidelity National Title | |
| Wells Craig R | $183,000 | Fidelity National Title |
Source: Public Records
Mortgage History
| Date | Status | Borrower | Loan Amount |
|---|---|---|---|
| Open | Hook Lynn F | $151,500 | |
| Previous Owner | Hook Lynn F | $149,800 | |
| Previous Owner | Wells Craig R | $173,850 |
Source: Public Records
Tax History Compared to Growth
Tax History
| Year | Tax Paid | Tax Assessment Tax Assessment Total Assessment is a certain percentage of the fair market value that is determined by local assessors to be the total taxable value of land and additions on the property. | Land | Improvement |
|---|---|---|---|---|
| 2025 | $4,326 | $335,456 | $134,181 | $201,275 |
| 2024 | $4,326 | $328,879 | $131,550 | $197,329 |
| 2023 | $4,065 | $322,431 | $128,971 | $193,460 |
| 2022 | $4,033 | $316,109 | $126,442 | $189,667 |
| 2021 | $3,989 | $309,911 | $123,962 | $185,949 |
| 2020 | $3,897 | $306,736 | $122,692 | $184,044 |
| 2019 | $3,717 | $300,723 | $120,287 | $180,436 |
| 2018 | $3,676 | $294,828 | $117,929 | $176,899 |
| 2017 | $3,587 | $289,048 | $115,617 | $173,431 |
| 2016 | $3,422 | $283,381 | $113,350 | $170,031 |
| 2015 | $3,343 | $279,127 | $111,649 | $167,478 |
| 2014 | $3,287 | $273,662 | $109,463 | $164,199 |
Source: Public Records
Map
Nearby Homes
- 42 Skyflower Ln Unit 249
- 1750 Tallowberry Ln
- 1675 Tanglebush Ln
- 233 E Bonita Dr
- 130 Farmhouse Dr Unit 2
- 76 Robbins Ct
- 114 Red Brick Dr Unit 1
- 151 Farmhouse Dr Unit 2
- 101 Red Brick Dr Unit 5
- 230 Farmhouse Dr Unit 3
- 300 Farmhouse Dr Unit 3
- 310 Farmhouse Dr Unit 4
- 265 Hermes St
- 252 Capri Dr
- 459 Mark Dr
- 75 Vista Lago Dr
- 2190 Electra Ave
- 1912 Autumnbreeze Place
- 1902 Winterdew Ave
- 1552 Cayton Place
- 1592 Cayton Place
- 1516 Emeric Ave
- 1504 Emeric Ave
- 1528 Emeric Ave
- 4 W Bonita Dr
- 4 E Bonita Dr
- 1567 Cayton Place
- 1591 Cayton Place
- 1530 Cayton Place
- 1551 Cayton Place
- 1534 Emeric Ave
- 16 E Bonita Dr
- 1508 Cayton Place
- 1517 Emeric Ave
- 1676 Emeric Ave
- 6 W Bonita Dr
- 1656 Emeric Ave
- 1546 Emeric Ave
- 1529 Cayton Place