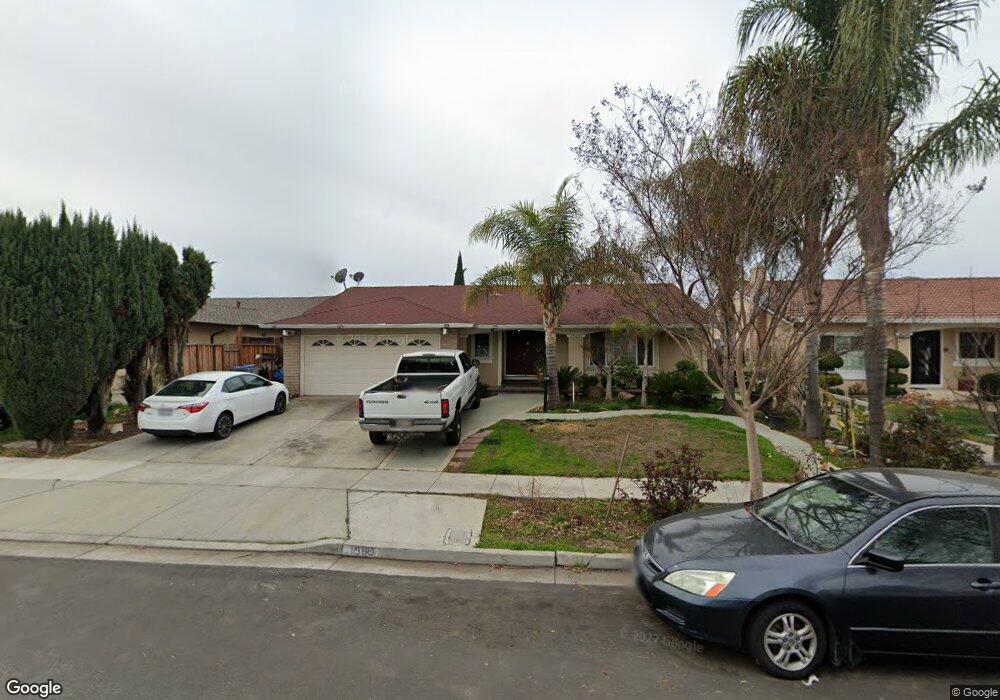
1569 Turriff Way San Jose, CA 95132
Ruskin NeighborhoodEstimated Value: $1,567,000 - $1,939,000
4
Beds
2
Baths
1,577
Sq Ft
$1,166/Sq Ft
Est. Value
About This Home
This home is located at 1569 Turriff Way, San Jose, CA 95132 and is currently estimated at $1,838,074, approximately $1,165 per square foot. 1569 Turriff Way is a home located in Santa Clara County with nearby schools including Ruskin Elementary School, Sierramont Middle School, and Piedmont Hills High School.
Ownership History
Date
Name
Owned For
Owner Type
Purchase Details
Closed on
Jul 8, 2020
Sold by
Nguyen Lan
Bought by
Nguyen Lan and Tran Loan Thi Kim
Current Estimated Value
Purchase Details
Closed on
Mar 23, 2004
Sold by
Nguyen Dat Phat
Bought by
Nguyen Lan
Home Financials for this Owner
Home Financials are based on the most recent Mortgage that was taken out on this home.
Original Mortgage
$440,000
Interest Rate
5.12%
Mortgage Type
Purchase Money Mortgage
Purchase Details
Closed on
Mar 19, 2004
Sold by
Nguyen Phat Ngoc
Bought by
Nguyen Lan
Home Financials for this Owner
Home Financials are based on the most recent Mortgage that was taken out on this home.
Original Mortgage
$440,000
Interest Rate
5.12%
Mortgage Type
Purchase Money Mortgage
Purchase Details
Closed on
Jan 6, 1999
Sold by
Wu Wen Chung S and Cheng Yuan T
Bought by
Nguyen Phat Ngoc
Home Financials for this Owner
Home Financials are based on the most recent Mortgage that was taken out on this home.
Original Mortgage
$260,800
Interest Rate
6.66%
Create a Home Valuation Report for This Property
The Home Valuation Report is an in-depth analysis detailing your home's value as well as a comparison with similar homes in the area
Home Values in the Area
Average Home Value in this Area
Purchase History
| Date | Buyer | Sale Price | Title Company |
|---|---|---|---|
| Nguyen Lan | $612,500 | None Available | |
| Nguyen Lan | -- | Fidelity National Title Ins | |
| Nguyen Lan | $550,000 | Fidelity National Title Ins | |
| Nguyen Phat Ngoc | $326,000 | Old Republic Title Company |
Source: Public Records
Mortgage History
| Date | Status | Borrower | Loan Amount |
|---|---|---|---|
| Previous Owner | Nguyen Lan | $440,000 | |
| Previous Owner | Nguyen Phat Ngoc | $260,800 |
Source: Public Records
Tax History Compared to Growth
Tax History
| Year | Tax Paid | Tax Assessment Tax Assessment Total Assessment is a certain percentage of the fair market value that is determined by local assessors to be the total taxable value of land and additions on the property. | Land | Improvement |
|---|---|---|---|---|
| 2025 | $15,092 | $1,091,604 | $700,356 | $391,248 |
| 2024 | $15,092 | $1,070,201 | $686,624 | $383,577 |
| 2023 | $14,843 | $1,049,217 | $673,161 | $376,056 |
| 2022 | $14,779 | $1,028,645 | $659,962 | $368,683 |
| 2021 | $14,322 | $1,008,476 | $647,022 | $361,454 |
| 2020 | $10,906 | $759,119 | $390,010 | $369,109 |
| 2019 | $10,492 | $744,235 | $382,363 | $361,872 |
| 2018 | $10,344 | $729,643 | $374,866 | $354,777 |
| 2017 | $10,411 | $715,337 | $367,516 | $347,821 |
| 2016 | $9,983 | $701,311 | $360,310 | $341,001 |
| 2015 | $9,870 | $690,777 | $354,898 | $335,879 |
| 2014 | $9,062 | $677,247 | $347,947 | $329,300 |
Source: Public Records
Map
Nearby Homes
- 2966 Crater Ln
- 1373 Ferrel Ct
- 1756 Valhalla Ct
- 2790 Longford Dr
- 3093 Melchester Dr
- 3070 Ironside Ct
- 1810 Blackmore Ct
- 2616 Sierra Village Ct
- 3190 Vesuvius Ln
- 1693 Peachwood Dr
- 2844 Parkrow Ln
- 1545 Stone Creek Dr
- 1199 Morrill Ave
- 3211 Parkhaven Dr
- 3252 Cropley Ave
- 3248 Woody Ln
- 3092 Halgrim Ct
- 2520 Amaryl Dr
- 2280 Zoria Cir
- 3108 Kermath Dr
- 1563 Turriff Way
- 1578 Stubbins Way
- 1584 Stubbins Way
- 1555 Turriff Way
- 1583 Turriff Way
- 1572 Stubbins Way
- 1588 Stubbins Way
- 1566 Stubbins Way
- 1570 Turriff Way
- 1578 Turriff Way
- 1549 Turriff Way
- 1591 Turriff Way
- 2952 Tantallon Ct
- 1584 Turriff Way
- 1594 Stubbins Way
- 1562 Stubbins Way
- 1541 Turriff Way
- 2959 Tantallon Ct
- 1597 Turriff Way
- 1592 Turriff Way