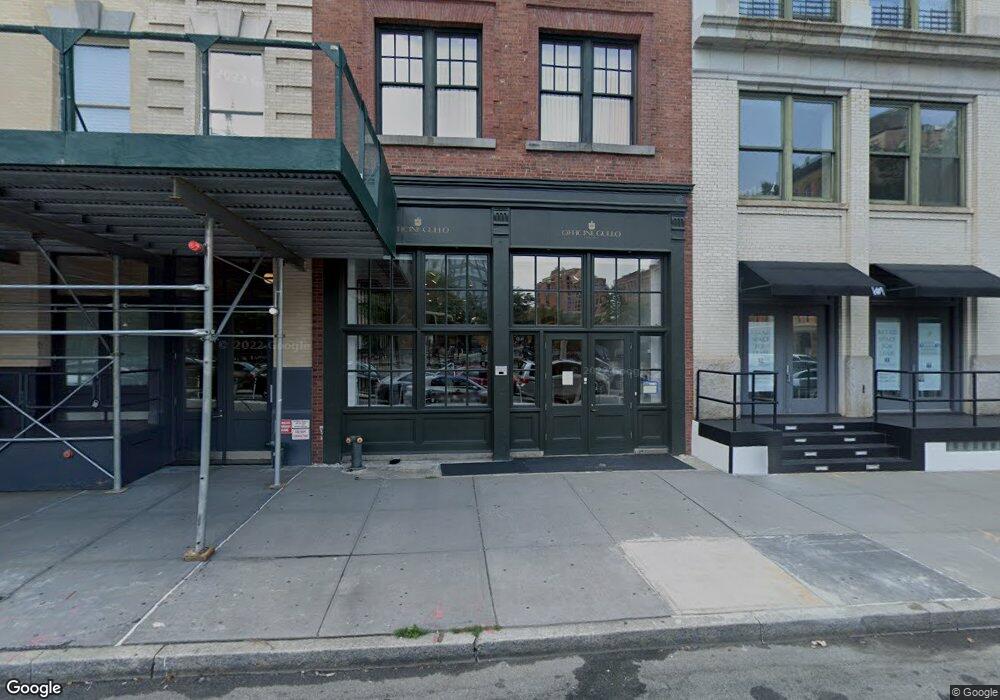
157 Hudson St Unit 5B New York, NY 10013
Tribeca NeighborhoodEstimated Value: $6,902,000 - $7,857,000
--
Bed
--
Bath
3,992
Sq Ft
$1,841/Sq Ft
Est. Value
About This Home
This home is located at 157 Hudson St Unit 5B, New York, NY 10013 and is currently estimated at $7,348,037, approximately $1,840 per square foot. 157 Hudson St Unit 5B is a home located in New York County with nearby schools including P.S. 234 Independence School, Middle School 297, and Lower Manhattan Community Middle School.
Ownership History
Date
Name
Owned For
Owner Type
Purchase Details
Closed on
Jun 26, 2023
Sold by
Anderson Crampton Nan Christina and Savington Crampton Christopher Adams
Bought by
60 Collister 5B Llc
Current Estimated Value
Purchase Details
Closed on
Oct 3, 2017
Sold by
Cook Rachel and Cook Stephen
Bought by
Crampton Christopher Adams Savington and Crampton Nan Christina
Home Financials for this Owner
Home Financials are based on the most recent Mortgage that was taken out on this home.
Original Mortgage
$1,487,500
Interest Rate
3.78%
Mortgage Type
Purchase Money Mortgage
Purchase Details
Closed on
May 8, 2012
Sold by
157 Ve Llc and % Ve Equites Llc
Bought by
Cook Rachel and Cook Stephen
Purchase Details
Closed on
Apr 13, 2012
Sold by
157 Hudson Llc
Bought by
157 Ve Llc
Create a Home Valuation Report for This Property
The Home Valuation Report is an in-depth analysis detailing your home's value as well as a comparison with similar homes in the area
Home Values in the Area
Average Home Value in this Area
Purchase History
| Date | Buyer | Sale Price | Title Company |
|---|---|---|---|
| 60 Collister 5B Llc | -- | -- | |
| Crampton Christopher Adams Savington | $7,850,000 | -- | |
| Cook Rachel | $5,702,200 | -- | |
| Cook Rachel | $5,702,200 | -- | |
| 157 Ve Llc | $3,605,875 | -- | |
| 157 Ve Llc | $3,605,875 | -- |
Source: Public Records
Mortgage History
| Date | Status | Borrower | Loan Amount |
|---|---|---|---|
| Previous Owner | Crampton Christopher Adams Savington | $1,487,500 |
Source: Public Records
Tax History Compared to Growth
Tax History
| Year | Tax Paid | Tax Assessment Tax Assessment Total Assessment is a certain percentage of the fair market value that is determined by local assessors to be the total taxable value of land and additions on the property. | Land | Improvement |
|---|---|---|---|---|
| 2025 | $70,690 | $583,859 | $40,190 | $543,669 |
| 2024 | $70,690 | $565,433 | $40,215 | $525,260 |
| 2023 | $68,288 | $546,217 | $40,162 | $506,055 |
| 2022 | $52,953 | $557,355 | $40,157 | $517,198 |
| 2021 | $60,733 | $504,818 | $40,157 | $464,661 |
| 2020 | $48,353 | $559,142 | $40,157 | $518,985 |
| 2019 | $45,198 | $546,568 | $40,157 | $506,411 |
| 2018 | $49,979 | $491,629 | $40,157 | $451,472 |
Source: Public Records
Map
Nearby Homes
- 60 Collister St Unit PH4A
- 415 Greenwich St Unit PH-A
- 52 Laight St Unit 2
- 165 Hudson St Unit 3B
- 165 Hudson St Unit PHA
- 169 Hudson St Unit 1-D
- 39 Vestry St Unit PHA
- 33 Vestry St Unit 6
- 135 Hudson St Unit 6F
- 71 Laight St Unit 3B
- 46 Laight St Unit 4
- 44 Laight St Unit 6C
- 76 Laight St Unit 3
- 181 Hudson St Unit 2B
- 443 Greenwich St Unit PH-D
- 60 Beach St Unit 3C
- 55 Vestry St Unit THA
- 53 N Moore St Unit 3A
- 53 N Moore St Unit 2F East
- 53 N Moore St Unit 2F
- 157 Hudson St Unit 5A
- 157 Hudson St Unit 4B
- 157 Hudson St Unit 4A
- 157 Hudson St Unit 3D
- 157 Hudson St Unit 3C
- 157 Hudson St Unit 3B
- 157 Hudson St Unit 3A
- 157 Hudson St Unit 2C
- 157 Hudson St Unit 2B
- 157 Hudson St Unit 2A
- 157 Hudson St Unit 1D
- 157 Hudson St Unit 1C
- 157 Hudson St Unit 1B
- 157 Hudson St Unit 1A
- 157 Hudson St Unit P6
- 157 Hudson St Unit 1E
- 157 Hudson St Unit P8
- 157 Hudson St Unit P5
- 157 Hudson St Unit P1
- 157 Hudson St Unit P7