Estimated Value: $97,000 - $169,000
2
Beds
1
Bath
1,043
Sq Ft
$134/Sq Ft
Est. Value
About This Home
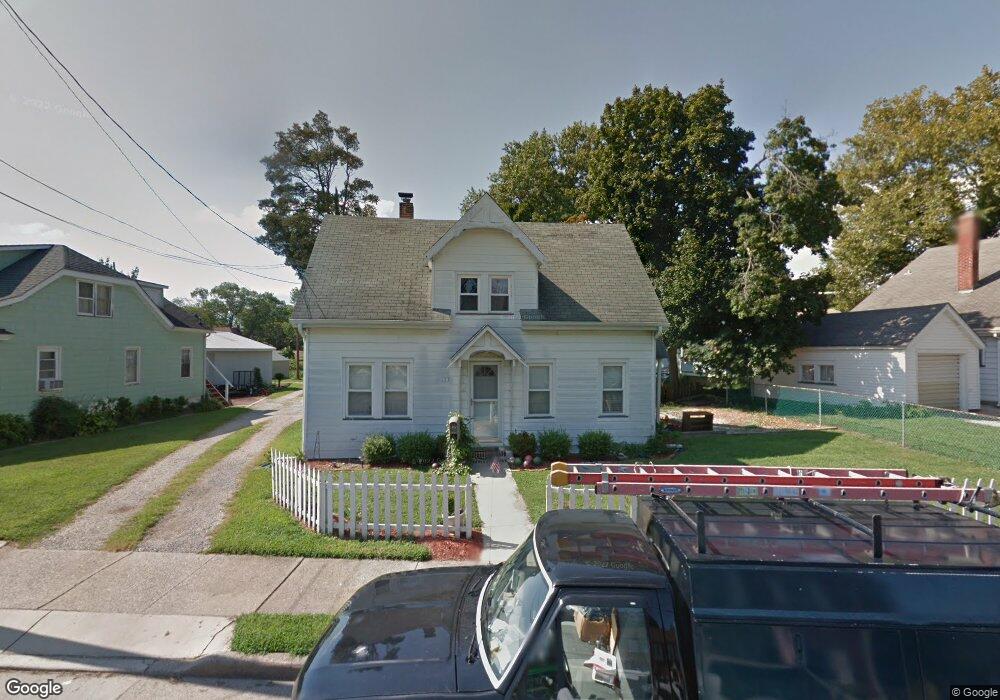
This home is located at 157 Johnson St, Salem, NJ 08079 and is currently estimated at $139,964, approximately $134 per square foot. 157 Johnson St is a home located in Salem County with nearby schools including John Fenwick Elementary School, Salem Middle School, and Salem High School.
Ownership History
Date
Name
Owned For
Owner Type
Purchase Details
Closed on
Aug 28, 2017
Sold by
Belenke Elissa
Bought by
Davis Robert L and Davis Emily H
Current Estimated Value
Purchase Details
Closed on
Jul 15, 2009
Sold by
U S Bank Na
Bought by
Belenke Elissa
Purchase Details
Closed on
May 2, 2008
Sold by
Miller Charles M Sheriff
Bought by
Us Bank Na Trustee
Purchase Details
Closed on
Oct 5, 2004
Sold by
Magill Ronald E and Correll Philip G
Bought by
Krissoff Joseph and Krissoff Susan N
Home Financials for this Owner
Home Financials are based on the most recent Mortgage that was taken out on this home.
Original Mortgage
$55,575
Interest Rate
5.84%
Mortgage Type
Purchase Money Mortgage
Create a Home Valuation Report for This Property
The Home Valuation Report is an in-depth analysis detailing your home's value as well as a comparison with similar homes in the area
Home Values in the Area
Average Home Value in this Area
Purchase History
| Date | Buyer | Sale Price | Title Company |
|---|---|---|---|
| Davis Robert L | $17,800 | West Jersey Title | |
| Belenke Elissa | $26,000 | -- | |
| Us Bank Na Trustee | -- | -- | |
| Krissoff Joseph | $58,500 | Salem Oak Title Agency Inc |
Source: Public Records
Mortgage History
| Date | Status | Borrower | Loan Amount |
|---|---|---|---|
| Previous Owner | Krissoff Joseph | $55,575 |
Source: Public Records
Tax History
| Year | Tax Paid | Tax Assessment Tax Assessment Total Assessment is a certain percentage of the fair market value that is determined by local assessors to be the total taxable value of land and additions on the property. | Land | Improvement |
|---|---|---|---|---|
| 2025 | $3,708 | $45,100 | $12,000 | $33,100 |
| 2024 | $3,545 | $45,100 | $12,000 | $33,100 |
Source: Public Records
Map
Nearby Homes
Your Personal Tour Guide
Ask me questions while you tour the home.