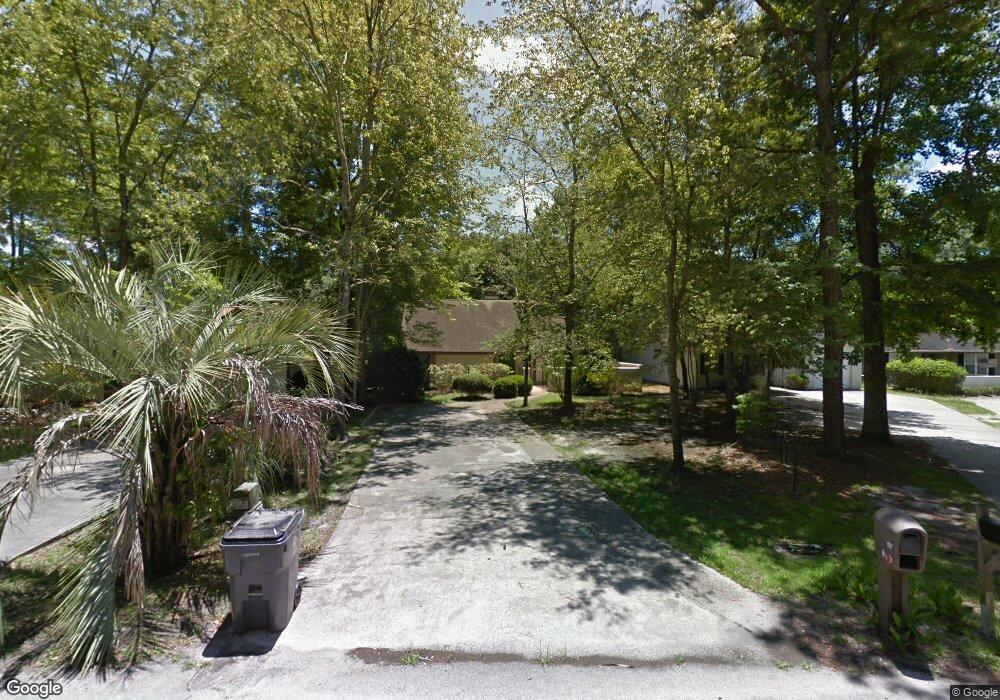
157 Quail Run Conway, SC 29526
Estimated Value: $276,000 - $298,000
3
Beds
2
Baths
1,430
Sq Ft
$202/Sq Ft
Est. Value
About This Home
This home is located at 157 Quail Run, Conway, SC 29526 and is currently estimated at $289,552, approximately $202 per square foot. 157 Quail Run is a home located in Horry County with nearby schools including Palmetto Bays Elementary School, Black Water Middle School, and Carolina Forest High School.
Ownership History
Date
Name
Owned For
Owner Type
Purchase Details
Closed on
May 11, 2023
Sold by
Peppard John P
Bought by
Oak Ridge Property Management Llc
Current Estimated Value
Home Financials for this Owner
Home Financials are based on the most recent Mortgage that was taken out on this home.
Original Mortgage
$210,000
Interest Rate
6.73%
Mortgage Type
New Conventional
Purchase Details
Closed on
Apr 6, 2023
Sold by
Asselin Jennifer
Bought by
Peppard John P
Home Financials for this Owner
Home Financials are based on the most recent Mortgage that was taken out on this home.
Original Mortgage
$210,000
Interest Rate
6.73%
Mortgage Type
New Conventional
Purchase Details
Closed on
May 15, 2017
Sold by
Reber Sally Anne
Bought by
Asselin Jennifer
Purchase Details
Closed on
Jan 5, 2011
Sold by
Stec Mary Jo
Bought by
Reber Sally Anne
Purchase Details
Closed on
Jan 6, 2005
Sold by
Stec Mary Jo
Bought by
Pandjak Mary Jo and Reber Sally Anne
Create a Home Valuation Report for This Property
The Home Valuation Report is an in-depth analysis detailing your home's value as well as a comparison with similar homes in the area
Home Values in the Area
Average Home Value in this Area
Purchase History
We collect this data history from publicly available records. To have your information removed, we recommend requesting removal directly through your county’s website.
| Date | Buyer | Sale Price | Title Company |
|---|---|---|---|
| Oak Ridge Property Management Llc | -- | -- | |
| Peppard John P | $300,000 | -- | |
| Asselin Jennifer | $105,000 | -- | |
| Reber Sally Anne | -- | -- | |
| Pandjak Mary Jo | -- | -- |
Source: Public Records
Mortgage History
We collect this data history from publicly available records. To have your information removed, we recommend requesting removal directly through your county’s website.
| Date | Status | Borrower | Loan Amount |
|---|---|---|---|
| Previous Owner | Peppard John P | $210,000 |
Source: Public Records
Tax History
| Year | Tax Paid | Tax Assessment Tax Assessment Total Assessment is a certain percentage of the fair market value that is determined by local assessors to be the total taxable value of land and additions on the property. | Land | Improvement |
|---|---|---|---|---|
| 2025 | $3,537 | $0 | $0 | $0 |
| 2024 | $3,537 | $17,147 | $4,500 | $12,647 |
| 2023 | $3,537 | $8,245 | $2,031 | $6,214 |
| 2021 | $1,844 | $8,782 | $2,050 | $6,732 |
| 2020 | $1,736 | $8,782 | $2,050 | $6,732 |
| 2019 | $1,736 | $8,782 | $2,050 | $6,732 |
| 2018 | $0 | $7,170 | $1,746 | $5,424 |
| 2017 | $278 | $7,170 | $1,746 | $5,424 |
| 2016 | -- | $4,780 | $1,164 | $3,616 |
| 2015 | $278 | $4,780 | $1,164 | $3,616 |
| 2014 | $258 | $4,780 | $1,164 | $3,616 |
Source: Public Records
Map
Nearby Homes
- 103 Wofford Ln
- 106 University Dr
- 104 University Cir
- 132 Wofford Rd
- 115 Wofford Rd
- 208 Lander Dr
- 119 University Cir
- 2311 S Carolina 544 Unit Kingswood
- 221 Lander Dr
- 460 Myrtle Greens Dr Unit 460
- Lot 11 Professional Park Dr
- 615 Carter Ln Unit D1
- 615 Carter Ln Unit B1
- 614 Lesia Ln
- 118 Erskine Dr
- 118 Clemson Rd
- 146 University Dr
- 1308 Wellfound Ct
- 106 Sharon Ct
- 240 Myrtle Greens Dr Unit J
Your Personal Tour Guide
Ask me questions while you tour the home.