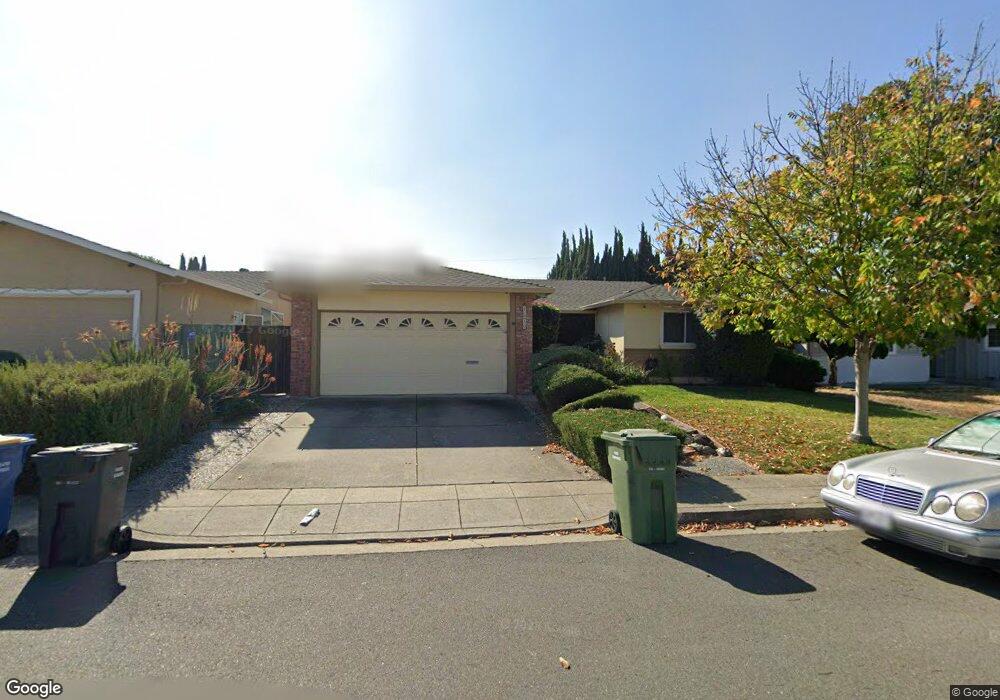
1570 Mount Shasta Ave Milpitas, CA 95035
Estimated Value: $1,545,000 - $1,834,000
4
Beds
2
Baths
1,737
Sq Ft
$983/Sq Ft
Est. Value
About This Home
This home is located at 1570 Mount Shasta Ave, Milpitas, CA 95035 and is currently estimated at $1,708,137, approximately $983 per square foot. 1570 Mount Shasta Ave is a home located in Santa Clara County with nearby schools including John Sinnott Elementary School, Rancho Milpitas Middle School, and Milpitas High School.
Ownership History
Date
Name
Owned For
Owner Type
Purchase Details
Closed on
Apr 30, 2003
Sold by
Vuong Julie P and Chow Wai
Bought by
Chow Wai Yan and Vuong Julie P
Current Estimated Value
Home Financials for this Owner
Home Financials are based on the most recent Mortgage that was taken out on this home.
Original Mortgage
$322,000
Interest Rate
5.84%
Mortgage Type
Purchase Money Mortgage
Purchase Details
Closed on
Nov 20, 2002
Sold by
Vuong Julie P
Bought by
Chow Wai and Vuong Julie P
Home Financials for this Owner
Home Financials are based on the most recent Mortgage that was taken out on this home.
Original Mortgage
$275,000
Interest Rate
6.12%
Mortgage Type
Balloon
Purchase Details
Closed on
Nov 20, 1997
Sold by
Mathis Charles C and Mathis Susan M
Bought by
Vuong Julie P
Home Financials for this Owner
Home Financials are based on the most recent Mortgage that was taken out on this home.
Original Mortgage
$208,000
Interest Rate
7.23%
Create a Home Valuation Report for This Property
The Home Valuation Report is an in-depth analysis detailing your home's value as well as a comparison with similar homes in the area
Home Values in the Area
Average Home Value in this Area
Purchase History
| Date | Buyer | Sale Price | Title Company |
|---|---|---|---|
| Chow Wai Yan | -- | -- | |
| Chow Wai | -- | Alliance Title Company | |
| Chow Wai | -- | Commonwealth Land Title | |
| Vuong Julie P | $288,000 | Commonwealth Land Title Co |
Source: Public Records
Mortgage History
| Date | Status | Borrower | Loan Amount |
|---|---|---|---|
| Closed | Chow Wai | $322,000 | |
| Previous Owner | Chow Wai | $275,000 | |
| Previous Owner | Vuong Julie P | $208,000 |
Source: Public Records
Tax History Compared to Growth
Tax History
| Year | Tax Paid | Tax Assessment Tax Assessment Total Assessment is a certain percentage of the fair market value that is determined by local assessors to be the total taxable value of land and additions on the property. | Land | Improvement |
|---|---|---|---|---|
| 2025 | $5,343 | $459,839 | $183,932 | $275,907 |
| 2024 | $5,343 | $450,824 | $180,326 | $270,498 |
| 2023 | $5,324 | $441,986 | $176,791 | $265,195 |
| 2022 | $5,303 | $433,321 | $173,325 | $259,996 |
| 2021 | $5,225 | $424,826 | $169,927 | $254,899 |
| 2020 | $5,134 | $420,471 | $168,185 | $252,286 |
| 2019 | $5,077 | $412,228 | $164,888 | $247,340 |
| 2018 | $4,825 | $404,146 | $161,655 | $242,491 |
| 2017 | $4,762 | $396,223 | $158,486 | $237,737 |
| 2016 | $4,567 | $388,455 | $155,379 | $233,076 |
| 2015 | $4,520 | $382,621 | $153,046 | $229,575 |
| 2014 | $4,390 | $375,127 | $150,049 | $225,078 |
Source: Public Records
Map
Nearby Homes
- 1536 Sonoma Dr
- 1612 Tahoe Dr
- 1710 Clear Lake Ave
- 1209 Glacier Dr
- 3139 Laneview Dr
- 3352 Landess Ave Unit D
- 2085 Ashwood Ln
- 2327 Farmcrest St
- 3544 Madrid Dr
- 484 Dempsey Rd Unit 185
- 3108 Kermath Dr
- 496 Dempsey Rd Unit 199
- 3248 Woody Ln
- 1501 Canton Dr
- 861 Garden St
- 3252 Cropley Ave
- 3555 Laurant Way
- 2844 Parkrow Ln
- 813 Garden St
- 1455 Cherry Cir
- 1558 Mount Shasta Ave
- 1582 Mount Shasta Ave
- 1577 Sonoma Dr
- 1546 Mount Shasta Ave
- 1565 Sonoma Dr
- 1575 Mount Shasta Ave
- 1587 Mount Shasta Ave
- 1553 Sonoma Dr
- 1563 Mount Shasta Ave
- 1534 Mount Shasta Ave
- 1599 Mount Shasta Ave
- 1551 Mount Shasta Ave
- 1541 Sonoma Dr
- 1522 Mount Shasta Ave
- 1539 Mount Shasta Ave
- 1572 Sonoma Dr
- 1576 Portola Dr
- 1529 Sonoma Dr
- 1560 Sonoma Dr
- 1564 Portola Dr