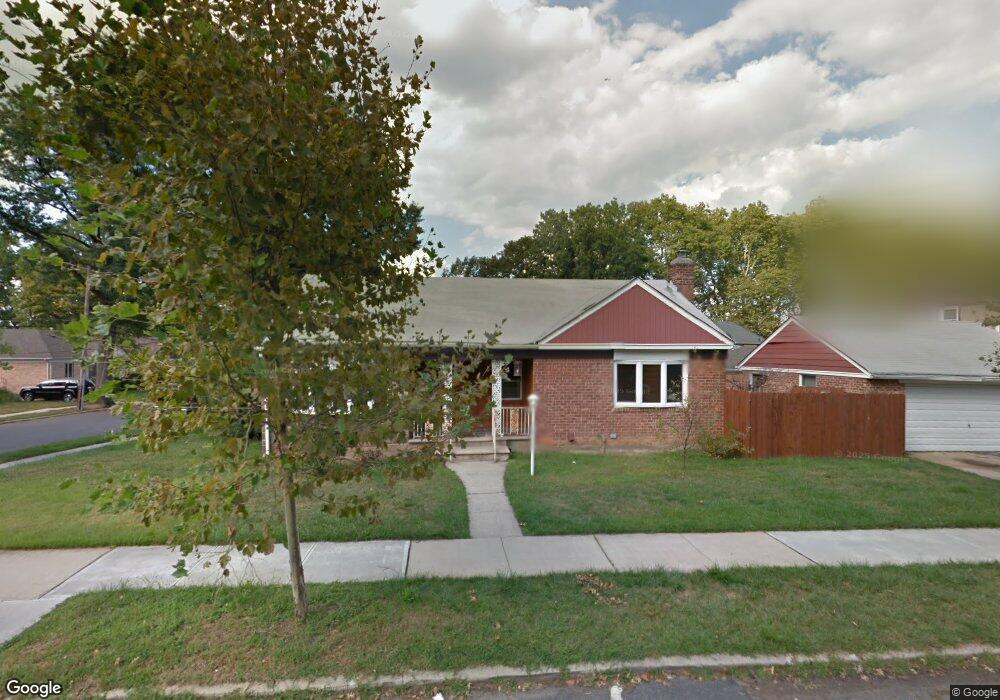
15705 28th Ave Flushing, NY 11354
Flushing NeighborhoodEstimated Value: $1,312,000 - $1,776,000
--
Bed
--
Bath
2,506
Sq Ft
$600/Sq Ft
Est. Value
About This Home
This home is located at 15705 28th Ave, Flushing, NY 11354 and is currently estimated at $1,503,892, approximately $600 per square foot. 15705 28th Ave is a home located in Queens County with nearby schools including P.S. 32 - State Street, I.S. 25 Adrien Block, and Francis Lewis High School.
Ownership History
Date
Name
Owned For
Owner Type
Purchase Details
Closed on
Aug 9, 2016
Sold by
Singh Jagrup and Singh Manwinder J
Bought by
Singh Manwinder J K and Singh Mohinder
Current Estimated Value
Purchase Details
Closed on
Jun 30, 2014
Sold by
Halloran Cynthia and Halloran Daniel
Bought by
Singh Jagrup and Singh Manwinder J
Purchase Details
Closed on
Feb 20, 2007
Sold by
Britt Lorraine and Cannonier Aaron N
Bought by
Cabri Apartments Llc
Purchase Details
Closed on
Nov 8, 2005
Sold by
Comoglio Jane and As Joint Tenant
Bought by
Halloran Cynthia and Halloran Daniel
Home Financials for this Owner
Home Financials are based on the most recent Mortgage that was taken out on this home.
Original Mortgage
$359,650
Interest Rate
6.06%
Mortgage Type
Purchase Money Mortgage
Purchase Details
Closed on
Jul 24, 1995
Sold by
Comoglio Albert A and Comoglio Jane
Bought by
Comoglio Jane and Comoglio Christine M
Create a Home Valuation Report for This Property
The Home Valuation Report is an in-depth analysis detailing your home's value as well as a comparison with similar homes in the area
Home Values in the Area
Average Home Value in this Area
Purchase History
| Date | Buyer | Sale Price | Title Company |
|---|---|---|---|
| Singh Manwinder J K | -- | -- | |
| Singh Manwinder J K | -- | -- | |
| Singh Manwinder J K | -- | -- | |
| Singh Jagrup | $705,000 | -- | |
| Singh Jagrup | $705,000 | -- | |
| Cabri Apartments Llc | -- | -- | |
| Cabri Apartments Llc | -- | -- | |
| Halloran Cynthia | $650,000 | -- | |
| Halloran Cynthia | $650,000 | -- | |
| Comoglio Jane | -- | Lawyers Title Insurance Corp | |
| Comoglio Jane | -- | Lawyers Title Insurance Corp |
Source: Public Records
Mortgage History
| Date | Status | Borrower | Loan Amount |
|---|---|---|---|
| Previous Owner | Halloran Cynthia | $125,000 | |
| Previous Owner | Halloran Cynthia | $359,650 |
Source: Public Records
Tax History Compared to Growth
Tax History
| Year | Tax Paid | Tax Assessment Tax Assessment Total Assessment is a certain percentage of the fair market value that is determined by local assessors to be the total taxable value of land and additions on the property. | Land | Improvement |
|---|---|---|---|---|
| 2025 | $14,060 | $70,001 | $21,308 | $48,693 |
| 2024 | $14,060 | $70,000 | $24,200 | $45,800 |
| 2023 | $13,461 | $67,021 | $25,482 | $41,539 |
| 2022 | $10,187 | $62,340 | $27,000 | $35,340 |
| 2021 | $10,780 | $58,920 | $27,000 | $31,920 |
| 2020 | $10,231 | $57,840 | $27,000 | $30,840 |
| 2019 | $10,111 | $56,580 | $27,000 | $29,580 |
| 2018 | $9,319 | $45,716 | $18,486 | $27,230 |
| 2017 | $8,792 | $43,130 | $19,750 | $23,380 |
| 2016 | $8,506 | $43,130 | $19,750 | $23,380 |
| 2015 | $4,907 | $40,143 | $21,511 | $18,632 |
| 2014 | $4,907 | $40,143 | $23,911 | $16,232 |
Source: Public Records
Map
Nearby Homes
- 28-14 157th St
- 15743 27th Ave
- 15428 27th Ave
- 154-28 27th Ave
- 154-23 28th Ave
- 15421 Bayside Ave
- 15911 29th Ave
- 154-19 26th Ave
- 154-43 25th Dr
- 29-05 160th St
- 16023 28th Ave
- 16042 26th Ave
- 2934 161st St
- 32-18 157th St
- 151-65 26th Ave
- 157-40 24th Rd
- 2914 162nd St
- 32-24 157th St
- 154-04 25th Ave
- 3225 155th St