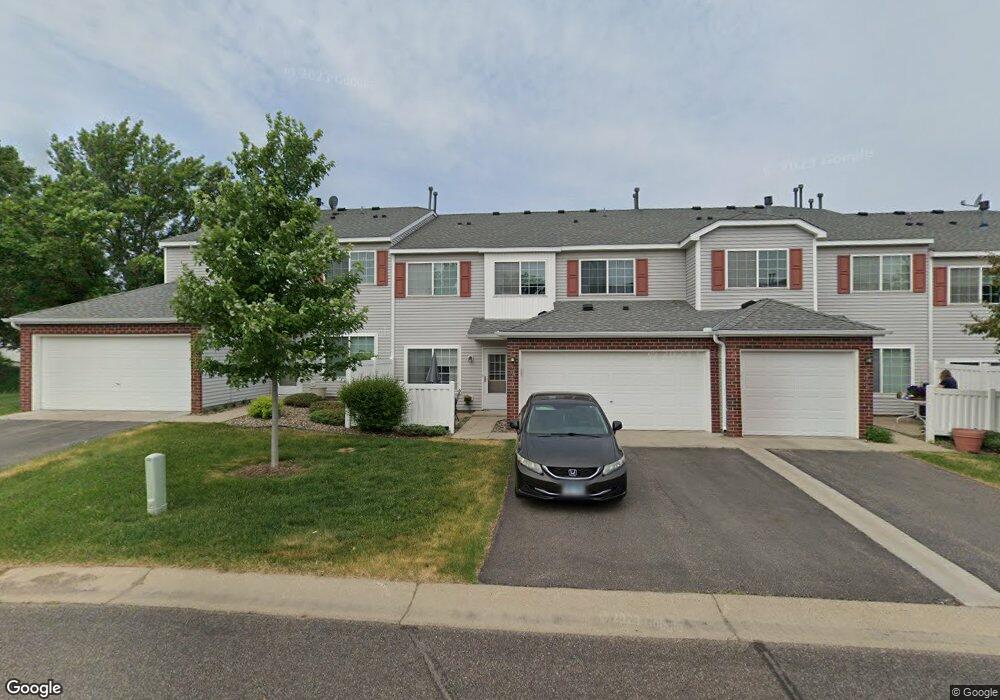
15719 Lower Fjord Way Unit 179 Saint Paul, MN 55124
Galaxie Commons NeighborhoodEstimated Value: $250,000 - $255,000
2
Beds
2
Baths
1,320
Sq Ft
$191/Sq Ft
Est. Value
About This Home
This home is located at 15719 Lower Fjord Way Unit 179, Saint Paul, MN 55124 and is currently estimated at $252,061, approximately $190 per square foot. 15719 Lower Fjord Way Unit 179 is a home located in Dakota County with nearby schools including Highland Elementary School, Scott Highlands Middle School, and Rosemount Senior High School.
Ownership History
Date
Name
Owned For
Owner Type
Purchase Details
Closed on
Oct 2, 2020
Sold by
Freeding Victoria
Bought by
Faraudo Carolina and Coronel Damian Calixto
Current Estimated Value
Purchase Details
Closed on
Nov 30, 2015
Sold by
Jorgenson Shawn K and Jorgenson Erin M
Bought by
Freeding Victoria
Home Financials for this Owner
Home Financials are based on the most recent Mortgage that was taken out on this home.
Original Mortgage
$133,000
Interest Rate
3.75%
Mortgage Type
New Conventional
Purchase Details
Closed on
Dec 9, 2009
Sold by
Workman Eric Alan
Bought by
Jorgenson Shawn K and Jorgenson Erin M
Home Financials for this Owner
Home Financials are based on the most recent Mortgage that was taken out on this home.
Original Mortgage
$134,518
Interest Rate
5%
Mortgage Type
FHA
Purchase Details
Closed on
May 18, 2001
Sold by
Agpalasin Joeffrey G and Agpalasin Deborah A
Bought by
Workman Eric A
Purchase Details
Closed on
Nov 15, 1999
Sold by
Pulte Homes Of Minnesota Corp
Bought by
Agpalasin Joeffrey G
Create a Home Valuation Report for This Property
The Home Valuation Report is an in-depth analysis detailing your home's value as well as a comparison with similar homes in the area
Home Values in the Area
Average Home Value in this Area
Purchase History
| Date | Buyer | Sale Price | Title Company |
|---|---|---|---|
| Faraudo Carolina | $205,000 | Results Title | |
| Freeding Victoria | $140,000 | Community Title & Escrow Llc | |
| Jorgenson Shawn K | $137,000 | -- | |
| Workman Eric A | $139,999 | -- | |
| Agpalasin Joeffrey G | $116,675 | -- | |
| Faraudo Carolina Carolina | $205,000 | -- |
Source: Public Records
Mortgage History
| Date | Status | Borrower | Loan Amount |
|---|---|---|---|
| Previous Owner | Freeding Victoria | $133,000 | |
| Previous Owner | Jorgenson Shawn K | $134,518 |
Source: Public Records
Tax History Compared to Growth
Tax History
| Year | Tax Paid | Tax Assessment Tax Assessment Total Assessment is a certain percentage of the fair market value that is determined by local assessors to be the total taxable value of land and additions on the property. | Land | Improvement |
|---|---|---|---|---|
| 2024 | $2,588 | $240,700 | $43,600 | $197,100 |
| 2023 | $2,588 | $228,100 | $42,700 | $185,400 |
| 2022 | $2,068 | $223,500 | $42,600 | $180,900 |
| 2021 | $1,896 | $192,000 | $37,000 | $155,000 |
| 2020 | $1,956 | $174,500 | $35,200 | $139,300 |
| 2019 | $1,673 | $174,400 | $33,600 | $140,800 |
| 2018 | $1,604 | $159,600 | $31,100 | $128,500 |
| 2017 | $1,642 | $148,500 | $28,800 | $119,700 |
| 2016 | $1,562 | $145,000 | $27,400 | $117,600 |
| 2015 | $1,373 | $113,180 | $22,062 | $91,118 |
| 2014 | -- | $99,555 | $19,673 | $79,882 |
| 2013 | -- | $93,996 | $17,410 | $76,586 |
Source: Public Records
Map
Nearby Homes
- 15682 Fjord Ave
- 6414 158th St W Unit 201
- 15792 Flan Ct
- 6456 157th St W
- 15645 Flight Ln
- 6068 158th Ct W
- 16123 Flagstaff Ct N
- 15352 Floret Way Unit 91
- 15521 Foghorn Ln
- 6744 Foliage Ct W
- 15602 Fairbrook Ct
- 6760 158th St W
- 5875 156th Way
- 6634 162nd Ct Unit 421
- 16294 Florida Way W
- 15425 Frost Path Unit 1403
- 6869 Folkestone Rd Unit 614
- 15705 Fremont Way
- 15323 Foliage Ave
- 15823 Freedom Ln
- 15719 Lower Fjord Way
- 15714 Flackwood Trail
- 15714 Flackwood Trail Unit 182
- 15717 Lower Fjord Way Unit 178
- 15721 Lower Fjord Way
- 15712 Flackwood Trail Unit 183
- 15716 Flackwood Trail
- 15716 Flackwood Trail Unit 181
- 15715 Lower Fjord Way
- 15715 Lower Fjord Way Unit 177
- 15718 Lower Fjord Way
- 15716 Lower Fjord Way
- 15741 Lower Fjord Way Unit 137
- 15717 Fjord Ave Unit 188
- 15713 Flackwood Trail Unit 169
- 15715 Flackwood Trail Unit 170
- 15714 Lower Fjord Way Unit 191
- 15715 Fjord Ave Unit 187
- 15743 Lower Fjord Way Unit 138
- 15755 Fjord Ave