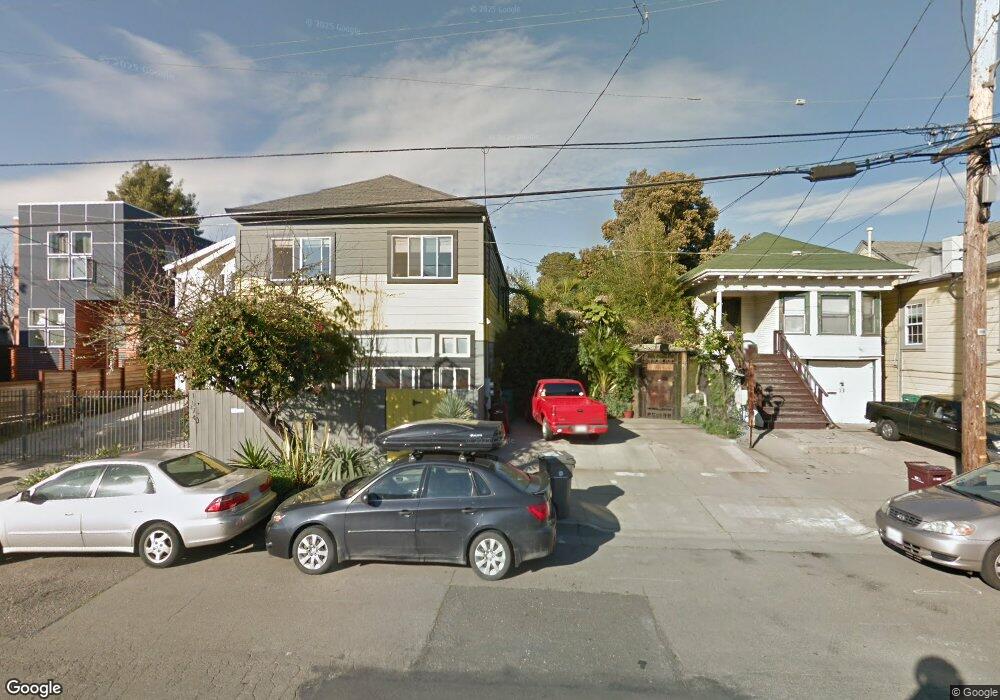
1572 5th St Oakland, CA 94607
West Oakland NeighborhoodEstimated Value: $544,000 - $895,000
3
Beds
1
Bath
1,221
Sq Ft
$545/Sq Ft
Est. Value
About This Home
This home is located at 1572 5th St, Oakland, CA 94607 and is currently estimated at $665,070, approximately $544 per square foot. 1572 5th St is a home located in Alameda County with nearby schools including Prescott Elementary School, West Oakland Middle School, and McClymonds High School.
Ownership History
Date
Name
Owned For
Owner Type
Purchase Details
Closed on
Apr 25, 2018
Sold by
Melcher Scott D
Bought by
Wahl Anthony
Current Estimated Value
Home Financials for this Owner
Home Financials are based on the most recent Mortgage that was taken out on this home.
Original Mortgage
$620,000
Outstanding Balance
$536,970
Interest Rate
4.75%
Mortgage Type
Adjustable Rate Mortgage/ARM
Estimated Equity
$128,100
Purchase Details
Closed on
Sep 17, 2013
Sold by
Melcher Scott D and Williams Michelle M
Bought by
Melcher Scott D
Create a Home Valuation Report for This Property
The Home Valuation Report is an in-depth analysis detailing your home's value as well as a comparison with similar homes in the area
Home Values in the Area
Average Home Value in this Area
Purchase History
| Date | Buyer | Sale Price | Title Company |
|---|---|---|---|
| Wahl Anthony | $775,000 | Old Republic Title Company | |
| Melcher Scott D | -- | Old Republic Title Company |
Source: Public Records
Mortgage History
| Date | Status | Borrower | Loan Amount |
|---|---|---|---|
| Open | Wahl Anthony | $620,000 |
Source: Public Records
Tax History Compared to Growth
Tax History
| Year | Tax Paid | Tax Assessment Tax Assessment Total Assessment is a certain percentage of the fair market value that is determined by local assessors to be the total taxable value of land and additions on the property. | Land | Improvement |
|---|---|---|---|---|
| 2025 | $11,251 | $765,000 | $229,500 | $535,500 |
| 2024 | $11,251 | $750,000 | $225,000 | $525,000 |
| 2023 | $13,378 | $720,000 | $216,000 | $504,000 |
| 2022 | $13,061 | $830,947 | $249,284 | $581,663 |
| 2021 | $12,561 | $814,656 | $244,397 | $570,259 |
| 2020 | $12,425 | $806,310 | $241,893 | $564,417 |
| 2019 | $12,004 | $790,500 | $237,150 | $553,350 |
| 2018 | $2,933 | $136,533 | $56,227 | $80,306 |
| 2017 | $2,787 | $133,856 | $55,125 | $78,731 |
| 2016 | $2,610 | $131,232 | $54,044 | $77,188 |
| 2015 | $2,591 | $129,262 | $53,233 | $76,029 |
| 2014 | $2,518 | $126,731 | $52,190 | $74,541 |
Source: Public Records
Map
Nearby Homes