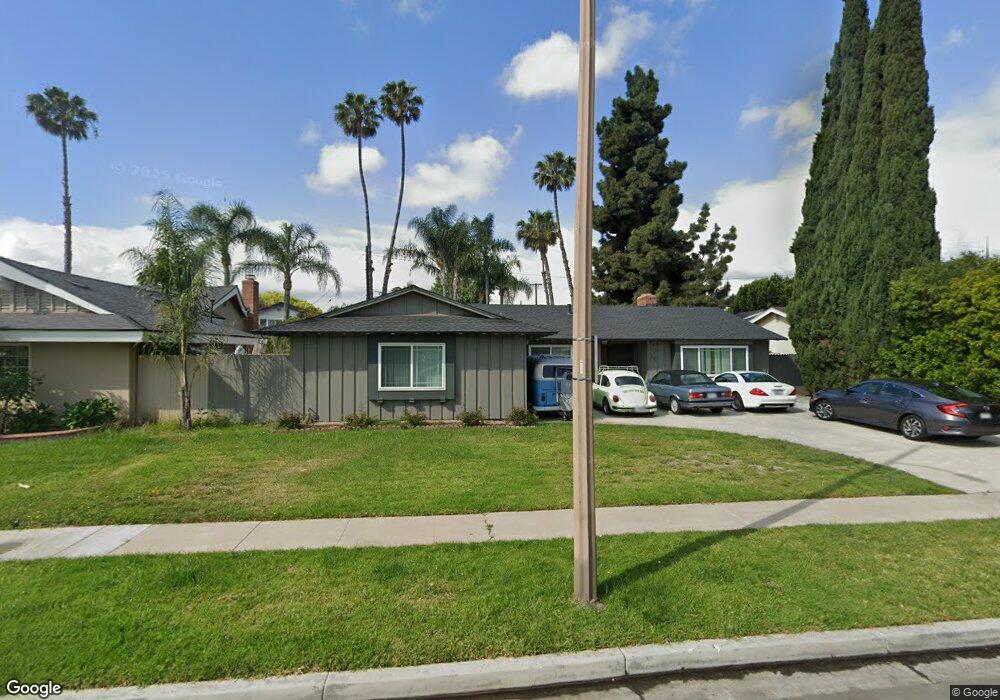
1572 Kalua Ln Tustin, CA 92780
Estimated Value: $1,197,041 - $1,424,000
4
Beds
2
Baths
1,563
Sq Ft
$827/Sq Ft
Est. Value
About This Home
This home is located at 1572 Kalua Ln, Tustin, CA 92780 and is currently estimated at $1,293,010, approximately $827 per square foot. 1572 Kalua Ln is a home located in Orange County with nearby schools including Red Hill Elementary School, C. E. Utt Middle School, and Tustin High School.
Ownership History
Date
Name
Owned For
Owner Type
Purchase Details
Closed on
Feb 8, 2013
Sold by
Knudson Thomas G and Knudson Lois M
Bought by
Knudson Thomas G and Knudson Lois M
Current Estimated Value
Home Financials for this Owner
Home Financials are based on the most recent Mortgage that was taken out on this home.
Original Mortgage
$180,000
Outstanding Balance
$126,178
Interest Rate
3.47%
Mortgage Type
New Conventional
Estimated Equity
$1,166,832
Purchase Details
Closed on
Jul 19, 2011
Sold by
Knudson Thomas G and Knudson Lois M
Bought by
Knudson Thomas G and Knudson Lois M
Purchase Details
Closed on
Aug 9, 2000
Sold by
Gugino Janet A
Bought by
Knudson Tom and Knudson Lois
Home Financials for this Owner
Home Financials are based on the most recent Mortgage that was taken out on this home.
Original Mortgage
$228,000
Interest Rate
7.9%
Create a Home Valuation Report for This Property
The Home Valuation Report is an in-depth analysis detailing your home's value as well as a comparison with similar homes in the area
Home Values in the Area
Average Home Value in this Area
Purchase History
| Date | Buyer | Sale Price | Title Company |
|---|---|---|---|
| Knudson Thomas G | -- | Chicago Title | |
| Knudson Thomas G | -- | Chicago Title | |
| Knudson Thomas G | -- | None Available | |
| Knudson Thomas G | -- | None Available | |
| Knudson Tom | $285,000 | First American Title Ins Co |
Source: Public Records
Mortgage History
| Date | Status | Borrower | Loan Amount |
|---|---|---|---|
| Open | Knudson Thomas G | $180,000 | |
| Previous Owner | Knudson Tom | $228,000 |
Source: Public Records
Tax History Compared to Growth
Tax History
| Year | Tax Paid | Tax Assessment Tax Assessment Total Assessment is a certain percentage of the fair market value that is determined by local assessors to be the total taxable value of land and additions on the property. | Land | Improvement |
|---|---|---|---|---|
| 2025 | $5,010 | $429,439 | $315,848 | $113,591 |
| 2024 | $5,010 | $421,019 | $309,655 | $111,364 |
| 2023 | $4,883 | $412,764 | $303,583 | $109,181 |
| 2022 | $4,805 | $404,671 | $297,630 | $107,041 |
| 2021 | $4,711 | $396,737 | $291,794 | $104,943 |
| 2020 | $4,686 | $392,669 | $288,802 | $103,867 |
| 2019 | $4,575 | $384,970 | $283,139 | $101,831 |
| 2018 | $4,502 | $377,422 | $277,587 | $99,835 |
| 2017 | $4,425 | $370,022 | $272,144 | $97,878 |
| 2016 | $4,348 | $362,767 | $266,808 | $95,959 |
| 2015 | $4,419 | $357,318 | $262,800 | $94,518 |
| 2014 | $4,308 | $350,319 | $257,652 | $92,667 |
Source: Public Records
Map
Nearby Homes
- 1431 Mauna Loa Rd
- 1621 Bryan Ave
- 13511 Epping Way
- 13121 Dean St
- 1209 E 1st St
- 1642 Tiffany Place
- 1161 Packers Cir Unit 102
- 13631 Fielding Dr
- 1125 E 1st St
- 1121 E 1st St
- 1370 San Juan St
- 13192 Ranchwood Rd
- 1042 San Juan St
- 1071 & 1073 Walnut St
- 1091 Bonita St
- 2196 Evergreen Dr
- 2226 Mccharles Dr
- 14032 Woodlawn Ave
- 479 E 1st St Unit 10
- 1112 1114 Napa St
- 1552 Kalua Ln
- 1582 Kalua Ln
- 13361 Diamond Head Dr
- 13362 Epping Way
- 1542 Kalua Ln
- 13371 Diamond Head Dr
- 1571 Kalua Ln
- 13372 Epping Way
- 1581 Kalua Ln
- 1551 Kalua Ln
- 13381 Diamond Head Dr
- 1522 Kalua Ln
- 1541 Kalua Ln
- 13352 Diamond Head Dr
- 13342 Diamond Head Dr
- 13382 Epping Way
- 13362 Diamond Head Dr
- 13372 Diamond Head Dr
- 13391 Diamond Head Dr
- 1521 Kalua Ln