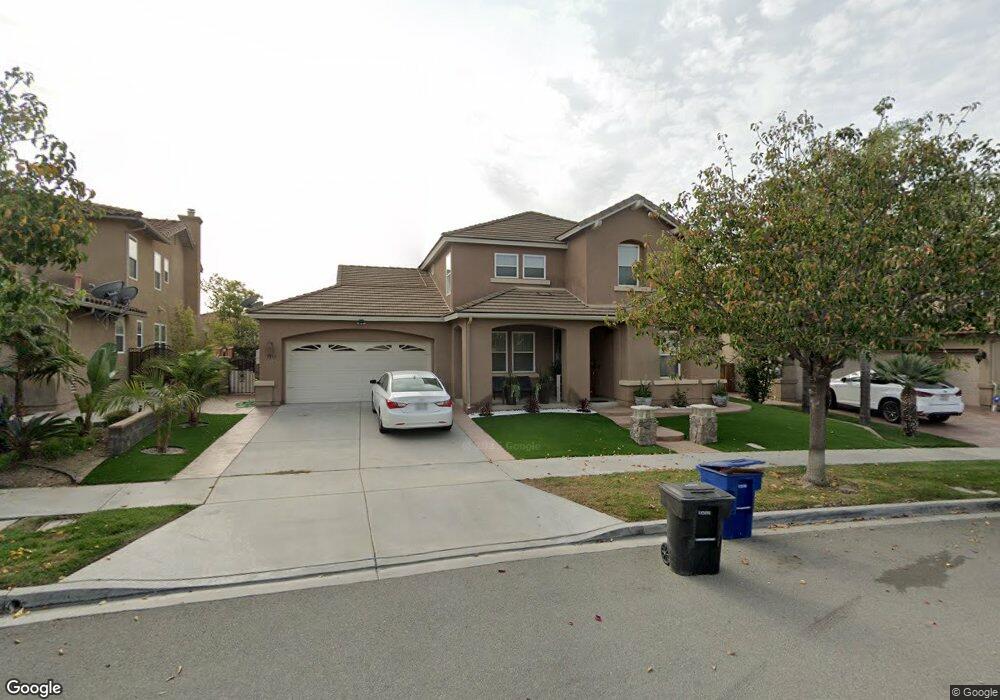
1572 Ravinia Dr Chula Vista, CA 91913
Otay Ranch NeighborhoodEstimated Value: $1,089,000 - $1,291,000
5
Beds
4
Baths
2,720
Sq Ft
$434/Sq Ft
Est. Value
About This Home
This home is located at 1572 Ravinia Dr, Chula Vista, CA 91913 and is currently estimated at $1,180,016, approximately $433 per square foot. 1572 Ravinia Dr is a home located in San Diego County with nearby schools including Veterans Elementary School, Rancho Del Rey Middle School, and Olympian High School.
Ownership History
Date
Name
Owned For
Owner Type
Purchase Details
Closed on
Jun 24, 2013
Sold by
Socal Business Partners Llc
Bought by
Amon Wenceslao M and Amon Liberty N
Current Estimated Value
Home Financials for this Owner
Home Financials are based on the most recent Mortgage that was taken out on this home.
Original Mortgage
$533,000
Outstanding Balance
$384,167
Interest Rate
3.79%
Mortgage Type
VA
Estimated Equity
$795,849
Purchase Details
Closed on
Apr 12, 2013
Sold by
Cruz Ferdinand O and Cruz Florelleen G
Bought by
Socal Business Partners Llc
Purchase Details
Closed on
Sep 24, 2004
Sold by
Mcmillin Auburn Lane Ii Llc
Bought by
Cruz Ferdinand O and Cruz Florelleen G
Home Financials for this Owner
Home Financials are based on the most recent Mortgage that was taken out on this home.
Original Mortgage
$532,000
Interest Rate
1%
Mortgage Type
New Conventional
Create a Home Valuation Report for This Property
The Home Valuation Report is an in-depth analysis detailing your home's value as well as a comparison with similar homes in the area
Home Values in the Area
Average Home Value in this Area
Purchase History
| Date | Buyer | Sale Price | Title Company |
|---|---|---|---|
| Amon Wenceslao M | $544,000 | First American Title | |
| Socal Business Partners Llc | $456,000 | None Available | |
| Cruz Ferdinand O | $665,500 | First American Title |
Source: Public Records
Mortgage History
| Date | Status | Borrower | Loan Amount |
|---|---|---|---|
| Open | Amon Wenceslao M | $533,000 | |
| Previous Owner | Cruz Ferdinand O | $532,000 | |
| Closed | Cruz Ferdinand O | $66,450 |
Source: Public Records
Tax History Compared to Growth
Tax History
| Year | Tax Paid | Tax Assessment Tax Assessment Total Assessment is a certain percentage of the fair market value that is determined by local assessors to be the total taxable value of land and additions on the property. | Land | Improvement |
|---|---|---|---|---|
| 2025 | $12,147 | $666,860 | $180,354 | $486,506 |
| 2024 | $12,147 | $653,785 | $176,818 | $476,967 |
| 2023 | $12,108 | $640,966 | $173,351 | $467,615 |
| 2022 | $11,809 | $628,399 | $169,952 | $458,447 |
| 2021 | $11,595 | $616,078 | $166,620 | $449,458 |
| 2020 | $11,346 | $609,762 | $164,912 | $444,850 |
| 2019 | $11,088 | $597,807 | $161,679 | $436,128 |
| 2018 | $10,901 | $586,086 | $158,509 | $427,577 |
| 2017 | $10,706 | $574,595 | $155,401 | $419,194 |
| 2016 | $10,346 | $563,329 | $152,354 | $410,975 |
| 2015 | $10,134 | $554,868 | $150,066 | $404,802 |
| 2014 | $9,015 | $544,000 | $147,127 | $396,873 |
Source: Public Records
Map
Nearby Homes
- 1583 Mount Tamalpais Ave Unit 1
- 2097 Bluestone Cir
- 1566 Calle de La Flor Unit 2
- 1518 Caminito Soria Unit 2
- 1676 Oconnor Ave
- 1682 May Ave
- 1679 Kincaid Ave
- 1548 Hunters Glen Ave
- 1757 Barbour Ave
- 1915 Caminito de la Cruz
- 1555 Tomillo Ln
- 1448 Water Lily Dr Unit 1
- 1875 Baudouin Place Unit 1731
- 1401 Caminito Capistrano Unit 1
- 1440 Levant Ln Unit 1
- 1518 Piedmont St
- 1631 Applegate St
- 779 Caminito Francisco Unit 1
- 1452 Canvas Dr Unit 1
- 1459 Sutter Buttes St
- 1576 Ravinia Dr
- 1568 Ravinia Dr
- 1579 Trailwood Ave
- 1573 Trailwood Ave
- 1585 Trailwood Ave
- 1747 Vendola Dr
- 1564 Ravinia Dr
- 1567 Trailwood Ave
- 1743 Vendola Dr
- 1571 Ravinia Dr
- 1575 Ravinia Dr
- 1739 Vendola Dr
- 1565 Ravinia Dr
- 1561 Trailwood Ave
- 1560 Ravinia Dr
- 1579 Ravinia Dr
- 1557 Trailwood Ave
- 1559 Ravinia Dr
- 1566 Solano Dr
- 1556 Ravinia Dr