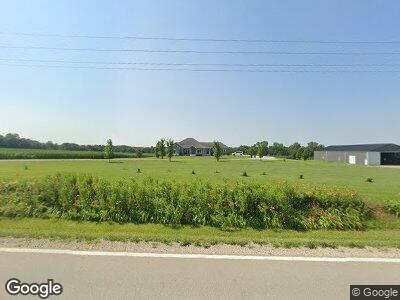
15721 K192 Hwy Winchester, KS 66097
Estimated Value: $367,000 - $666,065
4
Beds
4
Baths
4,374
Sq Ft
$118/Sq Ft
Est. Value
About This Home
This home is located at 15721 K192 Hwy, Winchester, KS 66097 and is currently estimated at $516,533, approximately $118 per square foot. 15721 K192 Hwy is a home located in Jefferson County with nearby schools including Jefferson County North Elementary/Middle School and Jefferson County North High School.
Ownership History
Date
Name
Owned For
Owner Type
Purchase Details
Closed on
Jun 3, 2024
Sold by
Lane Kevin M and Lane Randi N
Bought by
Abel Jared
Current Estimated Value
Home Financials for this Owner
Home Financials are based on the most recent Mortgage that was taken out on this home.
Original Mortgage
$696,000
Outstanding Balance
$680,059
Interest Rate
0.59%
Mortgage Type
Construction
Estimated Equity
-$124,382
Purchase Details
Closed on
Apr 16, 2010
Bought by
Lane Kevin M and Lane Randi N
Create a Home Valuation Report for This Property
The Home Valuation Report is an in-depth analysis detailing your home's value as well as a comparison with similar homes in the area
Home Values in the Area
Average Home Value in this Area
Purchase History
| Date | Buyer | Sale Price | Title Company |
|---|---|---|---|
| Abel Jared | $870,000 | Assured Title Co/Ne Ks | |
| Lane Kevin M | -- | -- |
Source: Public Records
Mortgage History
| Date | Status | Borrower | Loan Amount |
|---|---|---|---|
| Open | Abel Jared | $696,000 |
Source: Public Records
Tax History Compared to Growth
Tax History
| Year | Tax Paid | Tax Assessment Tax Assessment Total Assessment is a certain percentage of the fair market value that is determined by local assessors to be the total taxable value of land and additions on the property. | Land | Improvement |
|---|---|---|---|---|
| 2024 | $9,501 | $78,639 | $8,520 | $70,119 |
| 2023 | $11,398 | $94,168 | $9,007 | $85,161 |
| 2022 | $5,674 | $85,195 | $7,987 | $77,208 |
| 2021 | $5,674 | $46,109 | $7,752 | $38,357 |
| 2020 | $5,674 | $44,204 | $7,594 | $36,610 |
| 2019 | $5,556 | $43,094 | $7,254 | $35,840 |
| 2018 | $5,298 | $40,537 | $6,760 | $33,777 |
| 2017 | $5,344 | $39,210 | $6,283 | $32,927 |
| 2016 | $5,219 | $38,615 | $5,746 | $32,869 |
| 2015 | -- | $37,568 | $5,218 | $32,350 |
| 2014 | -- | $38,158 | $5,616 | $32,542 |
Source: Public Records
Map
Nearby Homes