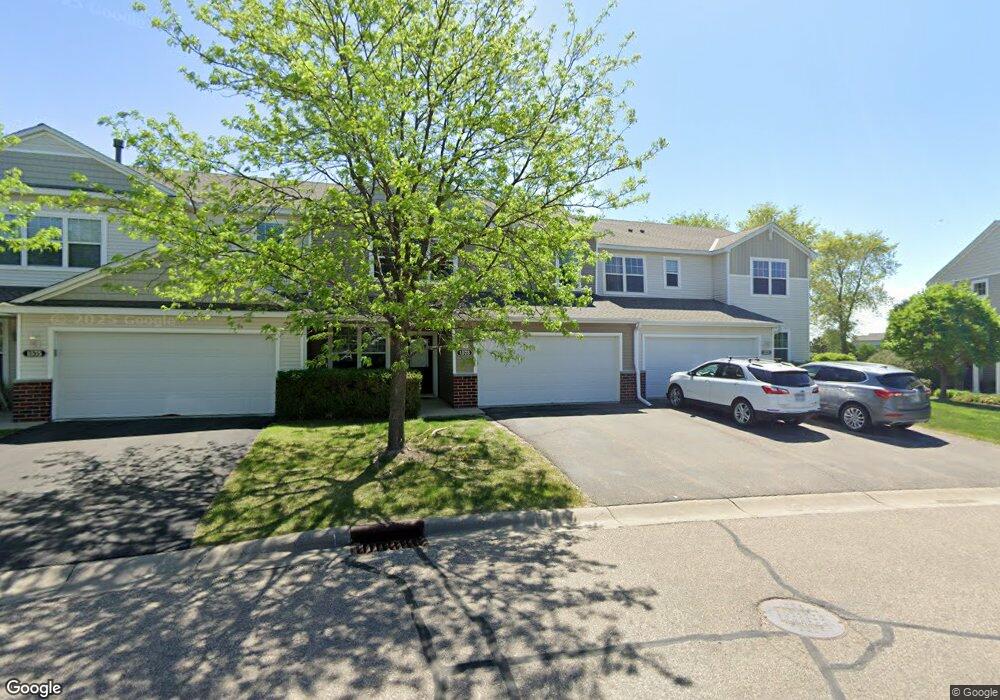
1573 Sumac Cir Carver, MN 55315
Estimated Value: $284,000 - $319,000
2
Beds
3
Baths
1,782
Sq Ft
$169/Sq Ft
Est. Value
About This Home
This home is located at 1573 Sumac Cir, Carver, MN 55315 and is currently estimated at $301,535, approximately $169 per square foot. 1573 Sumac Cir is a home located in Carver County with nearby schools including Carver Elementary School, Pioneer Ridge Middle School, and Chaska High School.
Ownership History
Date
Name
Owned For
Owner Type
Purchase Details
Closed on
Jan 30, 2019
Sold by
Kelly Christopher A and Kelly Christine
Bought by
Wolf Robert J and Wolf Cynthia K
Current Estimated Value
Purchase Details
Closed on
Feb 27, 2016
Sold by
The Secretary Of Housing & Urban Develop
Bought by
Kelly Christopher A
Home Financials for this Owner
Home Financials are based on the most recent Mortgage that was taken out on this home.
Original Mortgage
$157,102
Interest Rate
3.62%
Mortgage Type
FHA
Purchase Details
Closed on
Oct 28, 2015
Sold by
Bank Of America Na
Bought by
The Secretary Of Housing & Urban Develop
Purchase Details
Closed on
May 22, 2015
Sold by
Romero Fernando Maya and Preciado Tarcila Curiel
Bought by
Bank Of America Na
Create a Home Valuation Report for This Property
The Home Valuation Report is an in-depth analysis detailing your home's value as well as a comparison with similar homes in the area
Home Values in the Area
Average Home Value in this Area
Purchase History
| Date | Buyer | Sale Price | Title Company |
|---|---|---|---|
| Wolf Robert J | $212,000 | Trademark Title Services Inc | |
| Kelly Christopher A | -- | Home Title Inc | |
| The Secretary Of Housing & Urban Develop | -- | Attorney | |
| Bank Of America Na | $152,000 | None Available |
Source: Public Records
Mortgage History
| Date | Status | Borrower | Loan Amount |
|---|---|---|---|
| Previous Owner | Kelly Christopher A | $157,102 |
Source: Public Records
Tax History Compared to Growth
Tax History
| Year | Tax Paid | Tax Assessment Tax Assessment Total Assessment is a certain percentage of the fair market value that is determined by local assessors to be the total taxable value of land and additions on the property. | Land | Improvement |
|---|---|---|---|---|
| 2025 | $3,134 | $265,600 | $55,000 | $210,600 |
| 2024 | $3,016 | $255,400 | $45,000 | $210,400 |
| 2023 | $2,952 | $250,600 | $45,000 | $205,600 |
| 2022 | $2,928 | $251,300 | $48,000 | $203,300 |
| 2021 | $2,644 | $195,800 | $32,600 | $163,200 |
| 2020 | $2,408 | $187,000 | $32,600 | $154,400 |
| 2019 | $2,358 | $176,600 | $31,100 | $145,500 |
| 2018 | $2,214 | $176,600 | $31,100 | $145,500 |
| 2017 | $2,218 | $168,600 | $28,300 | $140,300 |
| 2016 | $2,294 | $141,200 | $0 | $0 |
| 2015 | -- | $120,300 | $0 | $0 |
| 2014 | -- | $94,900 | $0 | $0 |
Source: Public Records
Map
Nearby Homes
- 1340 Chestnut Cir
- 1656 White Pine Way Unit B
- 1430 Nutmeg Cir
- 986 Sunny Ridge Dr
- 1507 Gable Dr
- 1437 Copper Hills Dr
- 2017 Mulberry Ln
- 2013 Mulberry Ln
- 2005 Mulberry Ln
- 1935 Tamarack Rd
- 1938 Tamarack Rd
- 1941 Tamarack Rd
- 1948 Tamarack Rd
- Foster Plan at Timber Creek - Heritage Collection
- Courtland II Plan at Timber Creek - Heritage Collection
- Sinclair Plan at Timber Creek - Discovery Collection
- Courtland Plan at Timber Creek - Heritage Collection
- Bristol Plan at Timber Creek - Heritage Collection
- Clearwater Plan at Timber Creek - Discovery Collection
- Donovan Plan at Timber Creek - Heritage Collection
- 1571 Sumac Cir
- 1575 Sumac Cir
- 1577 Sumac Cir
- 1569 Sumac Cir
- 1567 Sumac Cir
- 1579 Sumac Cir
- 1581 Sumac Cir
- 1565 Sumac Cir
- 1563 Sumac Cir
- 1583 Sumac Cir
- 2002 Fulton Ct
- 1923 Balsam Dr
- 2022 Tamarack Rd
- 1921 Balsam Dr
- 1912 Boulder Way
- 1918 Balsam Dr
- 2039 Tamarack Rd
- 1916 Balsam Dr
- 2003 Fulton Ct
- 1922 Arbor Ln