
Seller's Agent in 2020
Michael Stephens
Corcoran Icon Properties
(510) 816-9693
126 Total Sales
Estimated Value: $1,202,433 - $1,521,000
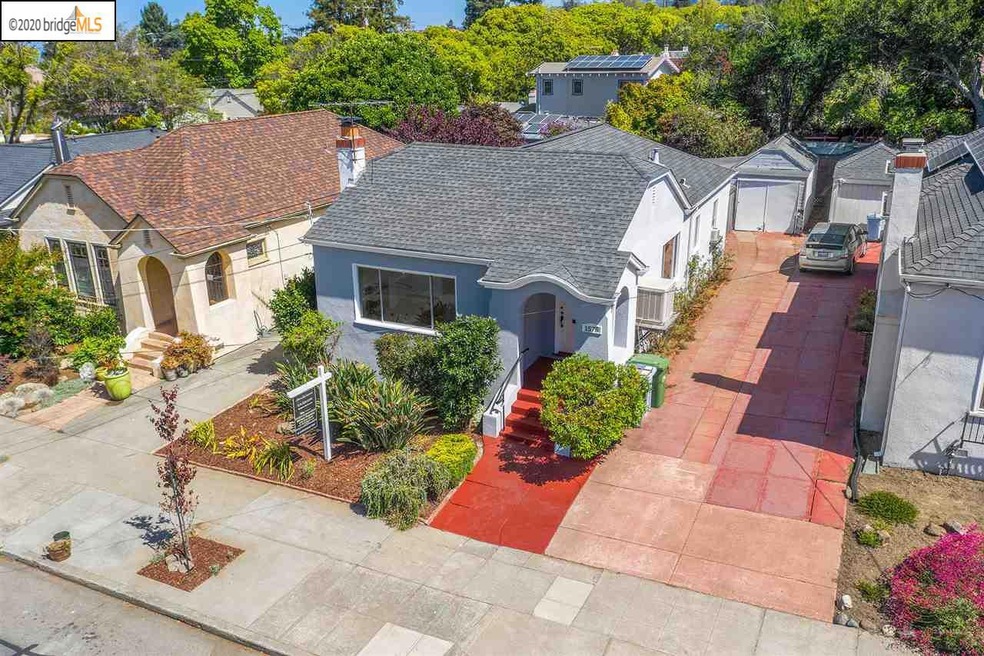
Near everything in North Berkeley. Minutes to BART, world class dining and parks. This home has all the features you want: hardwood floors, a spacious dining room with built in cabinets, eat-in kitchen, nice flow to the deck and patio in the backyard for many BBQ's and parties, A/C, laundry room and fireplace.
Last Agent to Sell the Property
Corcoran Icon Properties License #01186416 Listed on: 07/10/2020
| Date | Buyer | Sale Price | Title Company |
|---|---|---|---|
| Craft Laura Richards | $1,010,000 | Chicago Title Company | |
| Hartman John Patrick | $574,500 | First American Title Company | |
| Dominguez Abel | $82,000 | New Century Title Company | |
| Dominguez Abel | $335,000 | First American Title Guarant |
| Date | Status | Borrower | Loan Amount |
|---|---|---|---|
| Previous Owner | Dominguez Abel | $246,000 | |
| Previous Owner | Dominguez Abel | $150,000 |
| Date | Event | Price | List to Sale | Price per Sq Ft |
|---|---|---|---|---|
| 06/16/2025 06/16/25 | Off Market | $1,010,000 | -- | -- |
| 02/04/2025 02/04/25 | Off Market | $1,010,000 | -- | -- |
| 08/10/2020 08/10/20 | Sold | $1,010,000 | +1.1% | $905 / Sq Ft |
| 07/30/2020 07/30/20 | Pending | -- | -- | -- |
| 07/10/2020 07/10/20 | For Sale | $999,000 | -- | $895 / Sq Ft |
| Year | Tax Paid | Tax Assessment Tax Assessment Total Assessment is a certain percentage of the fair market value that is determined by local assessors to be the total taxable value of land and additions on the property. | Land | Improvement |
|---|---|---|---|---|
| 2025 | $17,031 | $1,138,159 | $327,973 | $817,186 |
| 2024 | $17,031 | $1,115,709 | $321,543 | $801,166 |
| 2023 | $16,323 | $1,050,803 | $315,241 | $735,562 |
| 2022 | $15,158 | $1,023,200 | $309,060 | $721,140 |
| 2021 | $15,223 | $1,003,000 | $303,000 | $707,000 |
| 2020 | $10,685 | $677,457 | $203,237 | $474,220 |
| 2019 | $10,315 | $664,174 | $199,252 | $464,922 |
| 2018 | $10,137 | $651,156 | $195,347 | $455,809 |
| 2017 | $9,777 | $638,390 | $191,517 | $446,873 |
| 2016 | $9,481 | $625,877 | $187,763 | $438,114 |
| 2015 | $9,352 | $616,481 | $184,944 | $431,537 |
| 2014 | $9,285 | $604,410 | $181,323 | $423,087 |
Seller's Agent in 2020
Michael Stephens
Corcoran Icon Properties
(510) 816-9693
126 Total Sales
Buyer's Agent in 2020
Colleen Larkin
THE GRUBB CO. INC.
(510) 816-2507
6 in this area
61 Total Sales
Source: bridgeMLS
MLS Number: 40911952
APN: 062-2868-016-00
Disclaimer: Certain information contained herein is derived from information provided by parties other than Homes.com. All information provided is deemed reliable, but is not guaranteed to be accurate and should be independently verified.
![]() Bay East 2026. CCAR 2026. bridgeMLS 2026. Information Deemed Reliable But Not Guaranteed. This information is being provided by the Bay East MLS, or CCAR MLS, or bridgeMLS. The listings presented here may or may not be listed by the Broker/Agent operating this website. This information is intended for the personal use of consumers and may not be used for any purpose other than to identify prospective properties consumers may be interested in purchasing.
Bay East 2026. CCAR 2026. bridgeMLS 2026. Information Deemed Reliable But Not Guaranteed. This information is being provided by the Bay East MLS, or CCAR MLS, or bridgeMLS. The listings presented here may or may not be listed by the Broker/Agent operating this website. This information is intended for the personal use of consumers and may not be used for any purpose other than to identify prospective properties consumers may be interested in purchasing.
Ask me questions while you tour the home.