
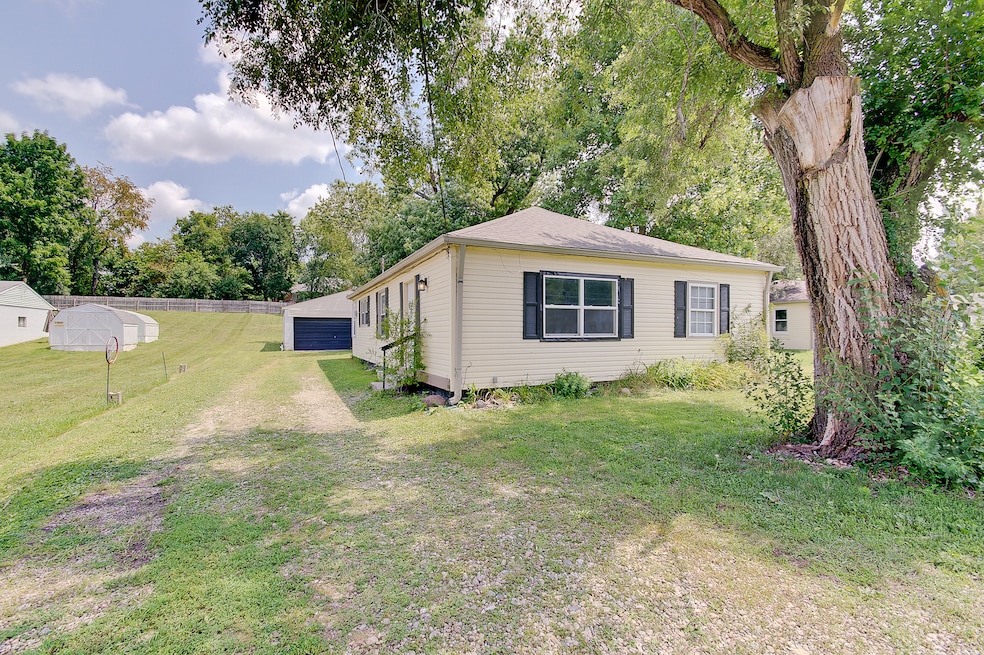
1575 S Morgantown Rd Greenwood, IN 46143
Frances-Stones Crossing Neighborhood
4
Beds
2
Baths
1,122
Sq Ft
0.5
Acres
Highlights
- Ranch Style House
- No HOA
- Eat-In Kitchen
- Sugar Grove Elementary School Rated A
- 2 Car Detached Garage
- Built-in Bookshelves
About This Home
As of January 2024Nestled in the heart of Center Grove, a remarkable home has just hit the market. This charming property boasts not only a prime location but also a plethora of new upgrades that are sure to captivate even the most discerning homebuyers. Set upon an expansive lot of almost an acre, this house offers a harmonious blend of contemporary design and comfortable living.
Last Agent to Sell the Property
Trendify Realty Brokerage Email: alucas@trendifyrealty.com License #RB15001567 Listed on: 08/12/2023
Home Details
Home Type
- Single Family
Est. Annual Taxes
- $876
Year Built
- Built in 1952
Lot Details
- 0.5 Acre Lot
Parking
- 2 Car Detached Garage
Home Design
- Ranch Style House
- Block Foundation
- Vinyl Siding
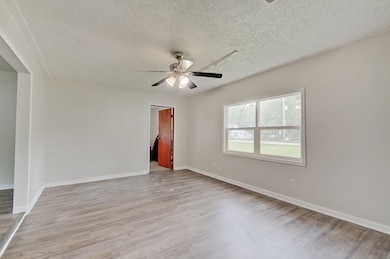
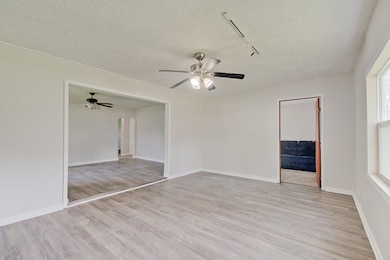
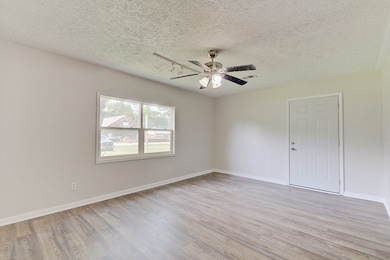
Interior Spaces
- 1,122 Sq Ft Home
- Built-in Bookshelves
- Family or Dining Combination
Kitchen
- Eat-In Kitchen
- Oven
- Gas Cooktop
- Microwave
- Disposal
Bedrooms and Bathrooms
- 4 Bedrooms
- Walk-In Closet
- 2 Full Bathrooms
Attic
- Attic Access Panel
- Pull Down Stairs to Attic
Utilities
- Heating System Uses Gas
- Gas Water Heater
Community Details
- No Home Owners Association
Listing and Financial Details
- Tax Lot 410403033010000038
- Assessor Parcel Number 410403033010000038
Ownership History
Date
Name
Owned For
Owner Type
Purchase Details
Closed on
Oct 30, 2023
Sold by
Gephart Keegan
Bought by
Emminger Mark and Emminger Melanie
Total Days on Market
45
Current Estimated Value
Home Financials for this Owner
Home Financials are based on the most recent Mortgage that was taken out on this home.
Original Mortgage
$184,300
Outstanding Balance
$181,704
Interest Rate
7.19%
Mortgage Type
New Conventional
Estimated Equity
$21,345
Purchase Details
Listed on
Feb 6, 2023
Closed on
Feb 17, 2023
Sold by
Doughty Thomas B
Bought by
Gephart Keegan
Seller's Agent
Beverly Beers
Keller Williams Indy Metro S
Buyer's Agent
Aaron Lucas
Trendify Realty
List Price
$160,000
Sold Price
$150,000
Premium/Discount to List
-$10,000
-6.25%
Views
55
Home Financials for this Owner
Home Financials are based on the most recent Mortgage that was taken out on this home.
Avg. Annual Appreciation
14.20%
Purchase Details
Listed on
Jun 8, 2021
Closed on
Nov 24, 2021
Sold by
Lewandowski Raymond
Bought by
Doughty Thomas B
Seller's Agent
Ron Rose
Indiana Realty Pros, Inc.
Buyer's Agent
Beverly Beers
Sold Price
$135,000
Home Financials for this Owner
Home Financials are based on the most recent Mortgage that was taken out on this home.
Avg. Annual Appreciation
8.94%
Purchase Details
Closed on
Oct 5, 2007
Sold by
Fannie Mae
Bought by
Lewandowski Raymond
Home Financials for this Owner
Home Financials are based on the most recent Mortgage that was taken out on this home.
Original Mortgage
$52,425
Interest Rate
6.33%
Mortgage Type
New Conventional
Purchase Details
Closed on
Aug 16, 2007
Sold by
Hardwick Tony D
Bought by
Federal National Mortgage Association
Home Financials for this Owner
Home Financials are based on the most recent Mortgage that was taken out on this home.
Original Mortgage
$52,425
Interest Rate
6.33%
Mortgage Type
New Conventional
Similar Homes in the area
Create a Home Valuation Report for This Property
The Home Valuation Report is an in-depth analysis detailing your home's value as well as a comparison with similar homes in the area
Home Values in the Area
Average Home Value in this Area
Purchase History
| Date | Type | Sale Price | Title Company |
|---|---|---|---|
| Warranty Deed | $190,000 | Security Title | |
| Warranty Deed | $150,000 | Alliance Title | |
| Warranty Deed | -- | None Available | |
| Special Warranty Deed | -- | None Available | |
| Sheriffs Deed | $84,898 | None Available |
Source: Public Records
Mortgage History
| Date | Status | Loan Amount | Loan Type |
|---|---|---|---|
| Open | $184,300 | New Conventional | |
| Previous Owner | $52,000 | New Conventional | |
| Previous Owner | $52,425 | New Conventional |
Source: Public Records
Property History
| Date | Event | Price | Change | Sq Ft Price |
|---|---|---|---|---|
| 01/17/2024 01/17/24 | Sold | $190,000 | 0.0% | $169 / Sq Ft |
| 09/27/2023 09/27/23 | Pending | -- | -- | -- |
| 09/25/2023 09/25/23 | Price Changed | $190,000 | -5.0% | $169 / Sq Ft |
| 09/11/2023 09/11/23 | Price Changed | $200,000 | -4.8% | $178 / Sq Ft |
| 09/06/2023 09/06/23 | Price Changed | $210,000 | -4.1% | $187 / Sq Ft |
| 08/28/2023 08/28/23 | Price Changed | $219,000 | -4.7% | $195 / Sq Ft |
| 08/12/2023 08/12/23 | For Sale | $229,900 | +53.3% | $205 / Sq Ft |
| 02/17/2023 02/17/23 | Sold | $150,000 | -6.3% | $134 / Sq Ft |
| 02/07/2023 02/07/23 | Pending | -- | -- | -- |
| 02/07/2023 02/07/23 | For Sale | $160,000 | +18.5% | $143 / Sq Ft |
| 11/24/2021 11/24/21 | Sold | $135,000 | 0.0% | $120 / Sq Ft |
| 11/01/2021 11/01/21 | Pending | -- | -- | -- |
| 10/26/2021 10/26/21 | For Sale | -- | -- | -- |
| 09/16/2021 09/16/21 | Pending | -- | -- | -- |
| 09/07/2021 09/07/21 | For Sale | -- | -- | -- |
| 09/01/2021 09/01/21 | Off Market | $135,000 | -- | -- |
| 09/01/2021 09/01/21 | For Sale | -- | -- | -- |
| 07/27/2021 07/27/21 | Off Market | $135,000 | -- | -- |
| 06/08/2021 06/08/21 | For Sale | $175,000 | 0.0% | $156 / Sq Ft |
| 07/31/2017 07/31/17 | Rented | $995 | 0.0% | -- |
| 07/28/2017 07/28/17 | Under Contract | -- | -- | -- |
| 07/15/2017 07/15/17 | For Rent | $995 | -- | -- |
Source: MIBOR Broker Listing Cooperative®
Tax History Compared to Growth
Tax History
| Year | Tax Paid | Tax Assessment Tax Assessment Total Assessment is a certain percentage of the fair market value that is determined by local assessors to be the total taxable value of land and additions on the property. | Land | Improvement |
|---|---|---|---|---|
| 2024 | $1,538 | $181,500 | $43,800 | $137,700 |
| 2023 | $1,056 | $141,900 | $43,800 | $98,100 |
| 2022 | $877 | $118,800 | $31,200 | $87,600 |
| 2021 | $707 | $107,200 | $31,200 | $76,000 |
| 2020 | $1,696 | $100,000 | $26,000 | $74,000 |
| 2019 | $1,598 | $93,500 | $22,700 | $70,800 |
| 2018 | $1,542 | $90,400 | $22,700 | $67,700 |
| 2017 | $1,513 | $89,600 | $21,900 | $67,700 |
| 2016 | $1,349 | $80,400 | $21,900 | $58,500 |
| 2014 | $1,385 | $81,500 | $21,900 | $59,600 |
| 2013 | $1,385 | $81,500 | $21,900 | $59,600 |
Source: Public Records
Agents Affiliated with this Home
-
Aaron Lucas
Seller's Agent in 2024
Aaron Lucas
Trendify Realty
(317) 939-3700
9 in this area
45 Total Sales
-
Lisa Wuertz
L
Buyer's Agent in 2024
Lisa Wuertz
F.C. Tucker Company
(317) 965-4060
1 in this area
16 Total Sales
-
Beverly Beers
B
Seller's Agent in 2023
Beverly Beers
Keller Williams Indy Metro S
(317) 750-3388
3 in this area
23 Total Sales
-
Ron Rose
Seller's Agent in 2021
Ron Rose
Indiana Realty Pros, Inc.
(317) 752-5304
41 in this area
243 Total Sales
-
Seller's Agent in 2017
Beth Solomon
Indiana Realty Pros, Inc.
(317) 650-3642
Map
Source: MIBOR Broker Listing Cooperative®
MLS Number: 21937599
APN: 41-04-03-033-010.000-038
Disclaimer: Certain information contained herein is derived from information provided by parties other than Homes.com. All information provided is deemed reliable, but is not guaranteed to be accurate and should be independently verified.
![]() Based on information submitted to the MLS GRID. All data is obtained from various sources and may not have been verified by broker or MLS GRID. Supplied Open House Information is subject to change without notice. All information should be independently reviewed and verified for accuracy. Properties may or may not be listed by the office/agent presenting the information. Some IDX listings have been excluded from this website.
Based on information submitted to the MLS GRID. All data is obtained from various sources and may not have been verified by broker or MLS GRID. Supplied Open House Information is subject to change without notice. All information should be independently reviewed and verified for accuracy. Properties may or may not be listed by the office/agent presenting the information. Some IDX listings have been excluded from this website.
Nearby Homes
- 1544 Olive Branch Cir
- 1662 Cascade Dr
- 1279 Windswept Dr
- 1239 Thornwood Dr
- 1255 Thornwood Dr
- 4356 Chital Place
- 1265 Sika Ln
- 4398 Chital Place
- 5301 Old Smith Valley Rd
- 1247 S Runyon Rd
- 1288 Ivory Ct
- 4401 W Hunters Ridge Ln
- 4437 Persian St
- 4411 Persian St
- 4397 Persian St
- 4400 Persian St
- 4372 Persian St
- 4355 Persian St
- 5601 Harness Dr
- 5580 Pintail Ln