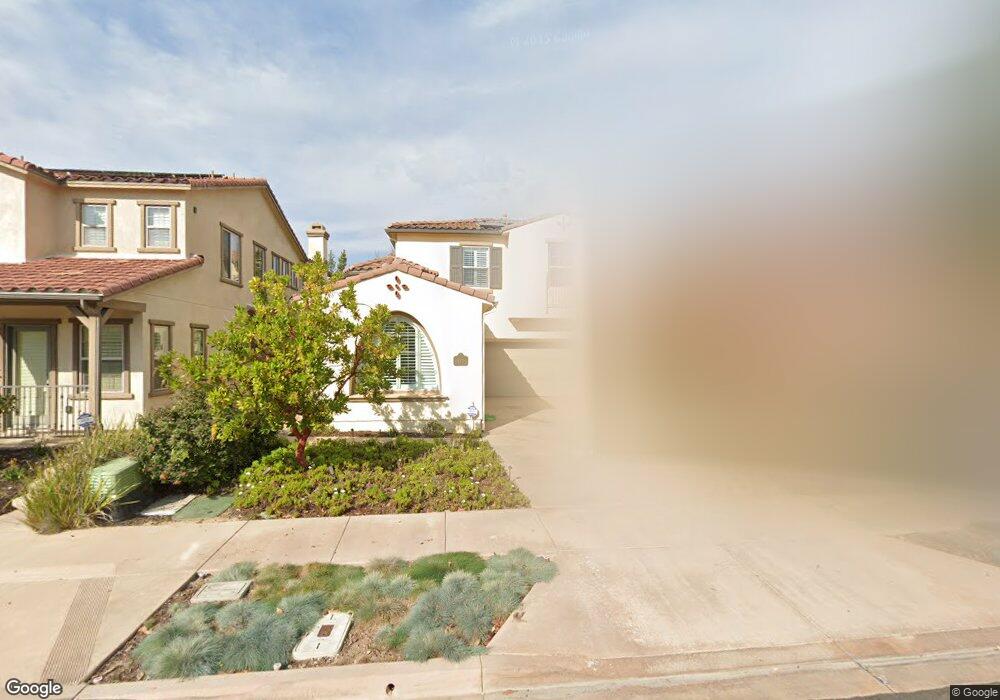
15772 Via Montenero San Diego, CA 92127
Del Sur NeighborhoodEstimated Value: $1,478,000 - $1,699,898
3
Beds
4
Baths
1,937
Sq Ft
$824/Sq Ft
Est. Value
About This Home
This home is located at 15772 Via Montenero, San Diego, CA 92127 and is currently estimated at $1,595,225, approximately $823 per square foot. 15772 Via Montenero is a home located in San Diego County with nearby schools including Del Sur Elementary School, Oak Valley Middle, and Del Norte High School.
Ownership History
Date
Name
Owned For
Owner Type
Purchase Details
Closed on
May 2, 2018
Sold by
Sadagopan Vijaykrishna and Ravichandran Divya
Bought by
Sadagopan Vijaykrishna and Ravichandran Divya
Current Estimated Value
Purchase Details
Closed on
Sep 1, 2012
Sold by
Sadagopan Vijaykrishna
Bought by
Sadagopan Vijaykrishna and Ravichandran Divya
Purchase Details
Closed on
Nov 17, 2011
Sold by
Shea Homes Limited Partnership
Bought by
Sadagopan Vijaykrishna and Ravichandran Divya
Home Financials for this Owner
Home Financials are based on the most recent Mortgage that was taken out on this home.
Original Mortgage
$417,000
Outstanding Balance
$283,115
Interest Rate
3.93%
Mortgage Type
New Conventional
Estimated Equity
$1,312,110
Purchase Details
Closed on
Oct 13, 2010
Sold by
Black Mountain Ranch Llc
Bought by
Shea Homes Limited Partnership
Purchase Details
Closed on
Apr 19, 2010
Sold by
Shea Homes Limited Partnership
Bought by
Del Sur Community Association
Create a Home Valuation Report for This Property
The Home Valuation Report is an in-depth analysis detailing your home's value as well as a comparison with similar homes in the area
Home Values in the Area
Average Home Value in this Area
Purchase History
| Date | Buyer | Sale Price | Title Company |
|---|---|---|---|
| Sadagopan Vijaykrishna | -- | None Available | |
| Sadagopan Vijaykrishna | -- | Ticor Title | |
| Sadagopan Vijaykrishna | -- | Ticor Title Company Of Ca | |
| Sadagopan Vijaykrishna | $529,500 | Chicago Title Company | |
| Shea Homes Limited Partnership | $2,467,500 | Chicago Title Company | |
| Del Sur Community Association | -- | Chicago Title Company |
Source: Public Records
Mortgage History
| Date | Status | Borrower | Loan Amount |
|---|---|---|---|
| Open | Sadagopan Vijaykrishna | $417,000 | |
| Closed | Shea Homes Limited Partnership | $0 |
Source: Public Records
Tax History Compared to Growth
Tax History
| Year | Tax Paid | Tax Assessment Tax Assessment Total Assessment is a certain percentage of the fair market value that is determined by local assessors to be the total taxable value of land and additions on the property. | Land | Improvement |
|---|---|---|---|---|
| 2025 | $13,940 | $665,044 | $288,886 | $376,158 |
| 2024 | $13,940 | $652,005 | $283,222 | $368,783 |
| 2023 | $13,627 | $639,221 | $277,669 | $361,552 |
| 2022 | $13,365 | $626,688 | $272,225 | $354,463 |
| 2021 | $13,113 | $614,401 | $266,888 | $347,513 |
| 2020 | $12,888 | $608,102 | $264,152 | $343,950 |
| 2019 | $12,598 | $596,179 | $258,973 | $337,206 |
| 2018 | $12,300 | $584,491 | $253,896 | $330,595 |
| 2017 | $12,056 | $573,031 | $248,918 | $324,113 |
| 2016 | $11,816 | $561,796 | $244,038 | $317,758 |
| 2015 | $11,613 | $553,358 | $240,373 | $312,985 |
| 2014 | $11,360 | $542,520 | $235,665 | $306,855 |
Source: Public Records
Map
Nearby Homes
- 15809 Concord Ridge Terrace
- 16055 Penny Ln
- 15701 Concord Ridge Terrace
- 16231 Sunny Summit Dr
- 8451 Hidden Cove Way
- 8528 Old Stonefield Chase
- 8492 Blackburn Ln
- 8458 Christopher Ridge Terrace
- 15763 Kristen Glen
- 15530 New Park Terrace
- 15583 Rising River Place S
- 15609 Hayden Lake Place
- 16750 Coyote Bush Dr Unit 18
- 16750 Coyote Bush Dr Unit 31
- 16750 Coyote Bush Dr Unit 114
- 16750 Coyote Bush Dr Unit 107
- 16636 Gill Loop
- 0 Artesian Trail S Unit SDC0001140
- 8318 The Landing Way
- 15963 Parkview Loop
- 15776 Via Montenero
- 15768 Via Montenero
- 15780 Via Montenero
- 15764 Via Montenero
- 15784 Via Montenero
- 15760 Via Montenero
- 16065 Newton Hill
- 15756 Via Montenero
- 15786 Via Montenero
- 16068 Newton Hill
- 16059 Newton Hill
- 16064 Paseo Montenero
- 15752 Via Montenero
- 16060 Newton Hill
- 16058 Paseo Montenero
- 15800 Via Montenero
- 15748 Via Montenero
- 16055 Newton Hill
- 16056 Newton Hill
- 16069 Wayne Hill