Estimated Value: $529,000 - $642,000
5
Beds
4
Baths
2,494
Sq Ft
$232/Sq Ft
Est. Value
About This Home
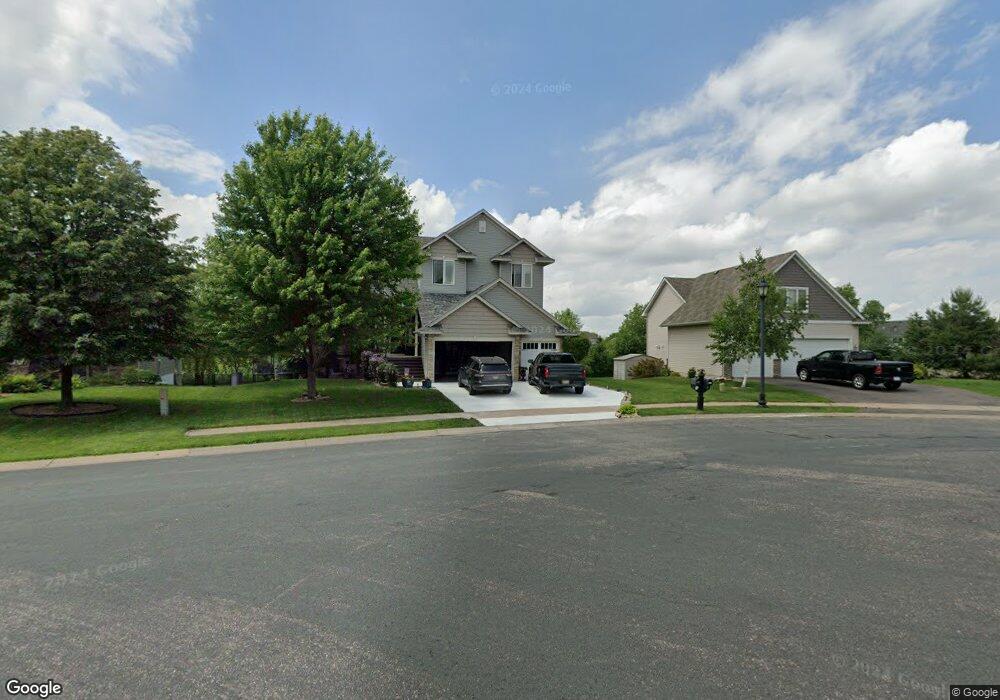
This home is located at 15782 Falcon Cir N, Hugo, MN 55038 and is currently estimated at $579,007, approximately $232 per square foot. 15782 Falcon Cir N is a home located in Washington County with nearby schools including Oneka Elementary School, Hugo Elementary School, and Central Middle School.
Ownership History
Date
Name
Owned For
Owner Type
Purchase Details
Closed on
Aug 1, 2013
Sold by
Rylander Jason M and Rylander Jessica L
Bought by
Knipping Patrick T and Knipping Celester W
Current Estimated Value
Home Financials for this Owner
Home Financials are based on the most recent Mortgage that was taken out on this home.
Original Mortgage
$277,600
Outstanding Balance
$207,262
Interest Rate
4.49%
Mortgage Type
New Conventional
Estimated Equity
$371,745
Purchase Details
Closed on
Dec 24, 2008
Sold by
Assured Funding Trust Ii
Bought by
Rylander Jason M and Dickey Jessica L
Home Financials for this Owner
Home Financials are based on the most recent Mortgage that was taken out on this home.
Original Mortgage
$266,400
Interest Rate
6.19%
Mortgage Type
New Conventional
Purchase Details
Closed on
Jan 13, 2004
Sold by
Waters Edge North Sf Llc
Bought by
Merit Custom Homes Inc
Create a Home Valuation Report for This Property
The Home Valuation Report is an in-depth analysis detailing your home's value as well as a comparison with similar homes in the area
Home Values in the Area
Average Home Value in this Area
Purchase History
| Date | Buyer | Sale Price | Title Company |
|---|---|---|---|
| Knipping Patrick T | $370,000 | Burnet Title | |
| Rylander Jason M | $333,000 | -- | |
| Merit Custom Homes Inc | $439,291 | -- |
Source: Public Records
Mortgage History
| Date | Status | Borrower | Loan Amount |
|---|---|---|---|
| Open | Knipping Patrick T | $277,600 | |
| Previous Owner | Rylander Jason M | $266,400 |
Source: Public Records
Tax History Compared to Growth
Tax History
| Year | Tax Paid | Tax Assessment Tax Assessment Total Assessment is a certain percentage of the fair market value that is determined by local assessors to be the total taxable value of land and additions on the property. | Land | Improvement |
|---|---|---|---|---|
| 2024 | $6,596 | $543,200 | $98,000 | $445,200 |
| 2023 | $6,596 | $599,400 | $133,000 | $466,400 |
| 2022 | $5,924 | $568,400 | $138,200 | $430,200 |
| 2021 | $5,872 | $471,600 | $110,000 | $361,600 |
| 2020 | $6,096 | $463,800 | $115,000 | $348,800 |
| 2019 | $5,234 | $461,100 | $105,000 | $356,100 |
| 2018 | $4,862 | $435,100 | $105,000 | $330,100 |
| 2017 | $4,270 | $413,900 | $100,000 | $313,900 |
| 2016 | $4,124 | $362,900 | $77,000 | $285,900 |
| 2015 | $4,368 | $355,200 | $66,100 | $289,100 |
| 2013 | -- | $312,500 | $52,000 | $260,500 |
Source: Public Records
Map
Nearby Homes
- 5082 157th St N
- 4798 Prairie Trail N
- 16109 Fairoaks Ave N
- 4905 Evergreen Dr N
- 4907 Evergreen Dr N
- 15895 Ethan Trail N
- 4840 Education Dr N
- 4901 Education Dr N
- 4838 Education Dr N
- 4831 Education Dr N
- 4845 Empress Ave N
- 15911 Finale Ct N
- 15921 Finale Ct N
- 16036 Ethan Trail N
- 16123 Europa Ave N
- The Mulberry Plan at Oneka Prairie
- The Waverly Plan at Oneka Prairie
- The Primrose Plan at Oneka Prairie
- The Newport Plan at Oneka Prairie
- The Brook View Plan at Oneka Prairie
- 15776 Falcon Cir N
- 15784 Falcon Cir N
- 15772 Falcon Cir N
- 15760 Falcon Cir N
- 15775 Falcon Cir N
- 15785 Falcon Cir N
- 15789 Falcon Cir N
- 15805 Fairoaks Ave N
- 15817 Fairoaks Ave N
- 15754 Falcon Cir N
- 15779 Fairoaks Ave N
- 15831 Fairoaks Ave N
- 5045 159th St N
- 15771 Fairoaks Ave N
- 15763 Falcon Cir N
- 5051 159th St N
- XXXX Falcon Ave N
- 15748 Falcon Cir N
- 15767 Fairoaks Ave N
- 5055 159th St N