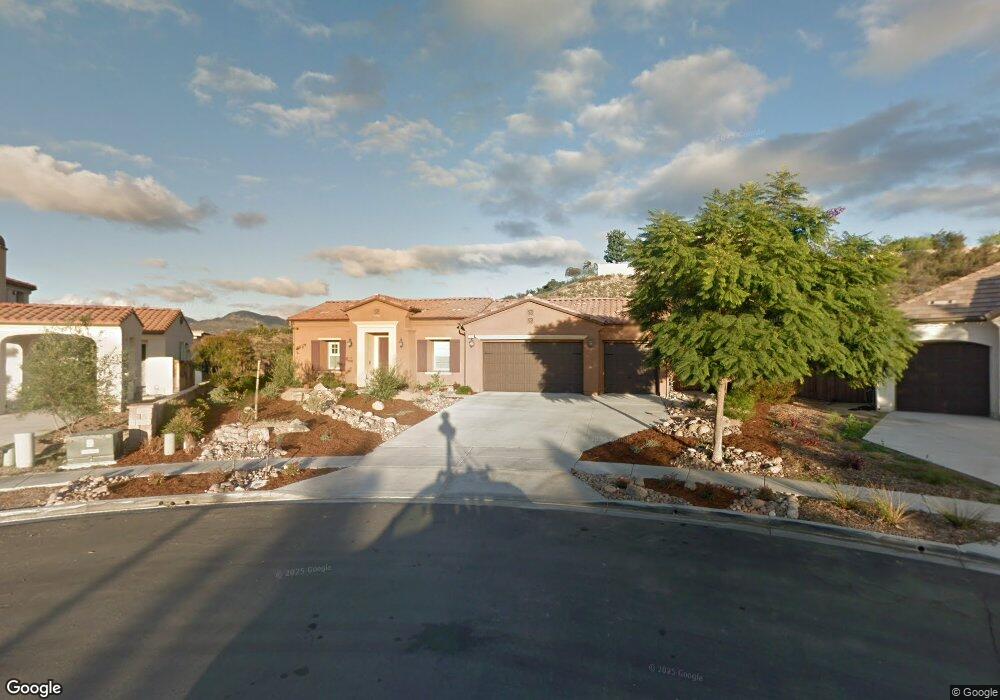
15790 E Bluff Cove San Diego, CA 92131
Rancho Encantada NeighborhoodEstimated Value: $2,448,927 - $2,839,000
4
Beds
5
Baths
3,738
Sq Ft
$688/Sq Ft
Est. Value
About This Home
This home is located at 15790 E Bluff Cove, San Diego, CA 92131 and is currently estimated at $2,570,732, approximately $687 per square foot. 15790 E Bluff Cove is a home located in San Diego County with nearby schools including Morning Creek Elementary School, Meadowbrook Middle, and Mt. Carmel High School.
Ownership History
Date
Name
Owned For
Owner Type
Purchase Details
Closed on
Feb 28, 2025
Sold by
Patrico Joseph N and Patrico Lisa
Bought by
Joseph And Lisa Patrico Family Trust and Patrico
Current Estimated Value
Purchase Details
Closed on
Aug 18, 2010
Sold by
Cv Viscaya 19 Llc
Bought by
Patrico Joseph N and Patrico Lisa
Home Financials for this Owner
Home Financials are based on the most recent Mortgage that was taken out on this home.
Original Mortgage
$687,451
Interest Rate
4.45%
Mortgage Type
New Conventional
Purchase Details
Closed on
Mar 23, 2010
Sold by
Warmington Scripps Ii Associates Lp
Bought by
Cv Viscaya 19 Llc
Purchase Details
Closed on
Aug 26, 2009
Sold by
Warmington Scripps Ii Associates Lp
Bought by
City Ventures Llc
Create a Home Valuation Report for This Property
The Home Valuation Report is an in-depth analysis detailing your home's value as well as a comparison with similar homes in the area
Home Values in the Area
Average Home Value in this Area
Purchase History
| Date | Buyer | Sale Price | Title Company |
|---|---|---|---|
| Joseph And Lisa Patrico Family Trust | -- | None Listed On Document | |
| Patrico Joseph N | $859,500 | First American Title Ins Co | |
| Cv Viscaya 19 Llc | $1,500,000 | First American Title | |
| City Ventures Llc | -- | First American Title Company |
Source: Public Records
Mortgage History
| Date | Status | Borrower | Loan Amount |
|---|---|---|---|
| Previous Owner | Patrico Joseph N | $687,451 |
Source: Public Records
Tax History Compared to Growth
Tax History
| Year | Tax Paid | Tax Assessment Tax Assessment Total Assessment is a certain percentage of the fair market value that is determined by local assessors to be the total taxable value of land and additions on the property. | Land | Improvement |
|---|---|---|---|---|
| 2025 | $17,899 | $1,163,725 | $288,259 | $875,466 |
| 2024 | $17,899 | $1,140,907 | $282,607 | $858,300 |
| 2023 | $17,466 | $1,118,537 | $277,066 | $841,471 |
| 2022 | $17,138 | $1,096,606 | $271,634 | $824,972 |
| 2021 | $16,808 | $1,075,105 | $266,308 | $808,797 |
| 2020 | $16,601 | $1,064,082 | $263,578 | $800,504 |
| 2019 | $16,285 | $1,043,218 | $258,410 | $784,808 |
| 2018 | $15,959 | $1,022,764 | $253,344 | $769,420 |
| 2017 | $82 | $1,002,711 | $248,377 | $754,334 |
| 2016 | $15,158 | $983,051 | $243,507 | $739,544 |
| 2015 | $14,907 | $968,286 | $239,850 | $728,436 |
| 2014 | $14,570 | $949,319 | $235,152 | $714,167 |
Source: Public Records
Map
Nearby Homes
- 15255 Via Santa Vienta
- 11550 Carowind Ln
- 14190 Green Valley Ct
- 14220 Green Valley Ct
- 14555 High Pine St
- 14594 Scarboro St
- 13024 Standish Dr
- 13735 Paseo Bonita
- 14543 Kittery St
- 14514 Kennebunk St
- 13388 Greenstone Ct
- 14287 Lolin Ln
- 13325 Floral Ave
- 13303 Greenstone Ct
- 000 Gate Dr
- 14429 Springvale St
- 14417 Springvale St
- 13432 Whitewater Dr
- 13435 Frey Ct
- 13409 Sutter Mill Rd
- 15791 E Bluff Cove
- 15772 E Bluff Cove
- 15763 E Bluff Cove
- 15754 E Bluff Cove
- 15745 E Bluff Cove
- 15736 E Bluff Cove
- 15727 E Bluff Cove
- 15718 E Bluff Cove
- 15709 E Bluff Cove Unit 8
- 15772 Bacara Ct
- 15780 Bacara Ct
- 15700 E Bluff Cove
- 15788 Bacara Ct
- 15764 Bacara Ct
- 15760 Cobble Creek Ln
- 15668 Cobble Creek Ln
- 15795 Bacara Ct
- 15756 Bacara Ct
- 15781 Bacara Ct
- 15773 Bacara Ct