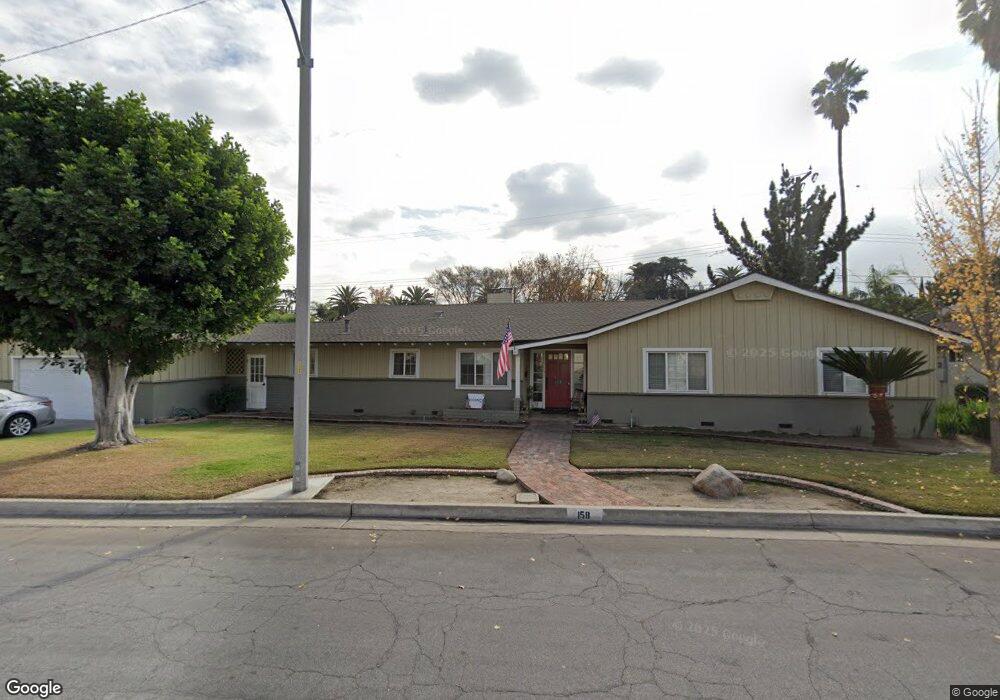
158 E Arthur Ave Arcadia, CA 91006
Estimated Value: $1,398,562 - $1,559,000
3
Beds
3
Baths
1,759
Sq Ft
$856/Sq Ft
Est. Value
About This Home
This home is located at 158 E Arthur Ave, Arcadia, CA 91006 and is currently estimated at $1,505,891, approximately $856 per square foot. 158 E Arthur Ave is a home located in Los Angeles County with nearby schools including Camino Grove Elementary School, Richard Henry Dana Middle School, and Arcadia High School.
Ownership History
Date
Name
Owned For
Owner Type
Purchase Details
Closed on
Mar 28, 2005
Sold by
Fang Kenneth and Fang Edeliza
Bought by
Fang Kenneth and Fang Edeliza
Current Estimated Value
Purchase Details
Closed on
Sep 12, 2002
Sold by
Fang Kenneth T H and Fang Edeliza Tumbucon
Bought by
Fang Kenneth T H and Fang Edeliza Tumbucon
Home Financials for this Owner
Home Financials are based on the most recent Mortgage that was taken out on this home.
Original Mortgage
$339,500
Outstanding Balance
$141,821
Interest Rate
6.24%
Estimated Equity
$1,364,070
Purchase Details
Closed on
Aug 29, 2000
Sold by
Decd Trust Watson Elizabeth M Tr John R Watso
Bought by
Fang Kenneth T H and Fang Edeliza Tumbucon
Home Financials for this Owner
Home Financials are based on the most recent Mortgage that was taken out on this home.
Original Mortgage
$330,000
Interest Rate
7.62%
Create a Home Valuation Report for This Property
The Home Valuation Report is an in-depth analysis detailing your home's value as well as a comparison with similar homes in the area
Home Values in the Area
Average Home Value in this Area
Purchase History
| Date | Buyer | Sale Price | Title Company |
|---|---|---|---|
| Fang Kenneth | -- | -- | |
| Fang Kenneth | -- | -- | |
| Fang Kenneth T H | -- | Landsafe Title | |
| Fang Kenneth T H | $430,000 | American Title Co |
Source: Public Records
Mortgage History
| Date | Status | Borrower | Loan Amount |
|---|---|---|---|
| Open | Fang Kenneth T H | $339,500 | |
| Closed | Fang Kenneth T H | $330,000 |
Source: Public Records
Tax History
| Year | Tax Paid | Tax Assessment Tax Assessment Total Assessment is a certain percentage of the fair market value that is determined by local assessors to be the total taxable value of land and additions on the property. | Land | Improvement |
|---|---|---|---|---|
| 2025 | $7,584 | $647,918 | $428,838 | $219,080 |
| 2024 | $7,584 | $635,215 | $420,430 | $214,785 |
| 2023 | $7,429 | $622,761 | $412,187 | $210,574 |
| 2022 | $7,190 | $610,551 | $404,105 | $206,446 |
| 2021 | $7,056 | $598,581 | $396,182 | $202,399 |
| 2019 | $6,890 | $580,829 | $384,432 | $196,397 |
| 2018 | $6,672 | $569,442 | $376,895 | $192,547 |
| 2016 | $6,482 | $547,331 | $362,260 | $185,071 |
| 2015 | $6,371 | $539,111 | $356,819 | $182,292 |
| 2014 | $6,287 | $528,552 | $349,830 | $178,722 |
Source: Public Records
Map
Nearby Homes
- 151 E Longden Ave
- 115 E Arthur Ave
- 1825 Lee Ave
- 2328 Lee Ave
- 521 Danimere Ave
- 1611 S 4th Ave
- 448 E Sandra Ave
- 2114 S 8th Ave
- 1500 S 3rd Ave
- 27 Miren Place
- 2809 Weidermeyer Ave
- 2813 Weidermeyer Ave
- 1431 S 6th Ave
- 2880 Foss Ave
- 2918 Foss Ave
- 131 Woodruff Place
- 127 Las Tunas Dr
- 2 Linda Rae Way
- 212 W Las Flores Ave
- 5533 Santa Anita Ave
- 2115 S 2nd Ave
- 150 E Arthur Ave
- 157 E Arthur Ave
- 155 E Longden Ave
- 163 E Longden Ave
- 2121 S 2nd Ave
- 151 E Arthur Ave
- 2111 S 2nd Ave
- 145 E Arthur Ave
- 143 E Longden Ave
- 171 E Longden Ave
- 140 E Arthur Ave
- 2031 S 2nd Ave
- 139 E Arthur Ave
- 168 E Las Flores Ave
- 139 E Longden Ave
- 146 E Las Flores Ave
- 2120 S 2nd Ave
- 132 E Arthur Ave
- 133 E Arthur Ave
Your Personal Tour Guide
Ask me questions while you tour the home.