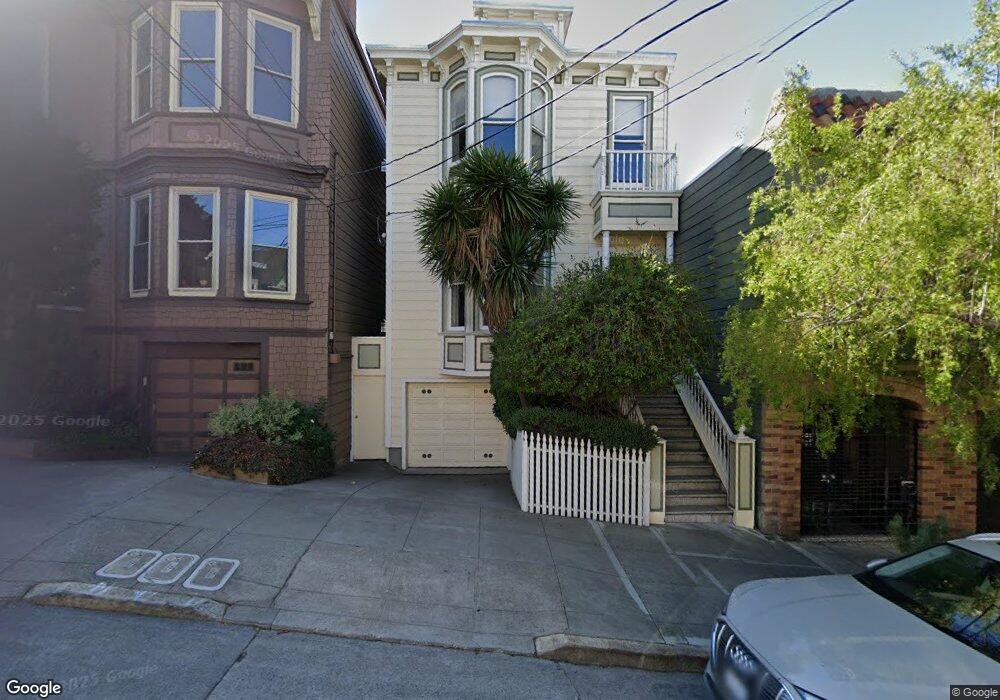
158 Eureka St Unit 158 San Francisco, CA 94114
Eureka Valley-Dolores Heights NeighborhoodEstimated Value: $1,279,415 - $1,827,000
--
Bed
--
Bath
1,102
Sq Ft
$1,342/Sq Ft
Est. Value
About This Home
This home is located at 158 Eureka St Unit 158, San Francisco, CA 94114 and is currently estimated at $1,479,354, approximately $1,342 per square foot. 158 Eureka St Unit 158 is a home located in San Francisco County with nearby schools including Harvey Milk Civil Rights Academy, Everett Middle School, and St. Philip School.
Ownership History
Date
Name
Owned For
Owner Type
Purchase Details
Closed on
Jul 26, 2006
Sold by
Johnson Leon S
Bought by
Johnson Leon S
Current Estimated Value
Home Financials for this Owner
Home Financials are based on the most recent Mortgage that was taken out on this home.
Original Mortgage
$711,000
Outstanding Balance
$355,539
Interest Rate
3.83%
Mortgage Type
New Conventional
Estimated Equity
$1,123,815
Purchase Details
Closed on
Oct 4, 2001
Sold by
Omahony Michael
Bought by
Johnson Leon S
Home Financials for this Owner
Home Financials are based on the most recent Mortgage that was taken out on this home.
Original Mortgage
$572,000
Interest Rate
6.91%
Purchase Details
Closed on
Mar 29, 2001
Sold by
Omahony Michael and Omahoney Michael
Bought by
Omahony Michael
Home Financials for this Owner
Home Financials are based on the most recent Mortgage that was taken out on this home.
Original Mortgage
$750,000
Interest Rate
7.06%
Mortgage Type
Construction
Create a Home Valuation Report for This Property
The Home Valuation Report is an in-depth analysis detailing your home's value as well as a comparison with similar homes in the area
Home Values in the Area
Average Home Value in this Area
Purchase History
| Date | Buyer | Sale Price | Title Company |
|---|---|---|---|
| Johnson Leon S | -- | Old Republic Title Company | |
| Johnson Leon S | -- | None Available | |
| Johnson Leon S | $715,000 | First American Title Co | |
| Omahony Michael | -- | First American Title Ins Co |
Source: Public Records
Mortgage History
| Date | Status | Borrower | Loan Amount |
|---|---|---|---|
| Open | Johnson Leon S | $711,000 | |
| Closed | Johnson Leon S | $572,000 | |
| Previous Owner | Omahony Michael | $750,000 |
Source: Public Records
Tax History Compared to Growth
Tax History
| Year | Tax Paid | Tax Assessment Tax Assessment Total Assessment is a certain percentage of the fair market value that is determined by local assessors to be the total taxable value of land and additions on the property. | Land | Improvement |
|---|---|---|---|---|
| 2025 | $12,838 | $1,056,254 | $528,127 | $528,127 |
| 2024 | $12,838 | $1,035,544 | $517,772 | $517,772 |
| 2023 | $12,640 | $1,015,240 | $507,620 | $507,620 |
| 2022 | $12,392 | $995,334 | $497,667 | $497,667 |
| 2021 | $12,170 | $975,818 | $487,909 | $487,909 |
| 2020 | $12,231 | $965,814 | $482,907 | $482,907 |
| 2019 | $11,812 | $946,878 | $473,439 | $473,439 |
| 2018 | $11,413 | $928,312 | $464,156 | $464,156 |
| 2017 | $10,979 | $910,110 | $455,055 | $455,055 |
| 2016 | $10,791 | $892,266 | $446,133 | $446,133 |
| 2015 | $10,656 | $878,864 | $439,432 | $439,432 |
| 2014 | -- | $861,650 | $430,825 | $430,825 |
Source: Public Records
Map
Nearby Homes
- 149 Eureka St
- 150 Eureka St Unit A
- 150 Eureka St Unit B
- 317 Douglass St Unit 317
- 65 Collingwood St Unit 1
- 59 Collingwood St
- 35 Hattie St
- 49 Seward St Unit 1
- 308 Diamond St
- 27 Saturn St
- 335 Diamond St
- 4038 18th St
- 3775 16th St
- 196 States St
- 10-12 A Saturn St
- 141 Lower Terrace
- 28 Flint St
- 2335 Market St
- 417-419 Eureka St
- 4106 20th St
- 160 Eureka St Unit 160
- 152 Eureka St
- 164 Eureka St Unit 166
- 170 Eureka St
- 168 Eureka St
- 150 Eureka St
- 172 Eureka St
- 178 Eureka St
- 138 Eureka St
- 182 Eureka St
- 231 Douglass St
- 229 Douglass St Unit A
- 229 Douglass St
- 233 Douglass St
- 235 Douglass St
- 4426 19th St
- 188 Eureka St
- 225 Douglass St
- 128 Eureka St
- 169 Eureka St