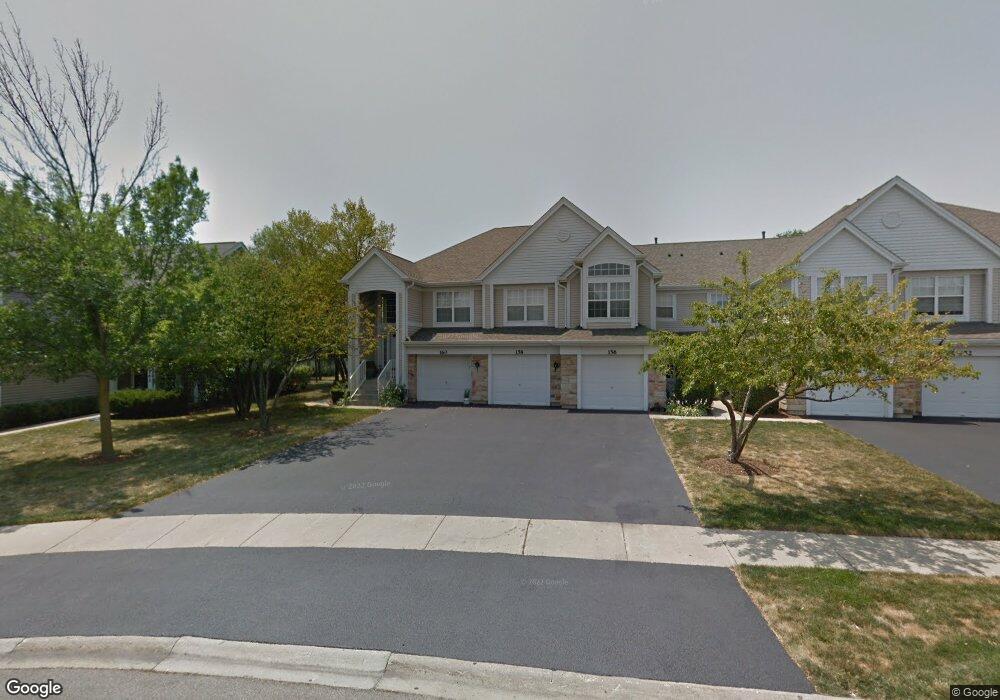
158 Fairfield Ln Carol Stream, IL 60188
South Carol Stream NeighborhoodEstimated Value: $252,201 - $280,000
--
Bed
1
Bath
1,018
Sq Ft
$261/Sq Ft
Est. Value
About This Home
This home is located at 158 Fairfield Ln, Carol Stream, IL 60188 and is currently estimated at $265,300, approximately $260 per square foot. 158 Fairfield Ln is a home located in DuPage County with nearby schools including Churchill Elementary School, Hadley Junior High School, and Glenbard West High School.
Ownership History
Date
Name
Owned For
Owner Type
Purchase Details
Closed on
Mar 7, 2017
Sold by
Labuhn Mary Ann
Bought by
Labuhn Mary Ann and Mary Ann Labuhn Land Trust
Current Estimated Value
Purchase Details
Closed on
Dec 14, 2016
Sold by
Mielke Mark P
Bought by
Labuhn Mary Ann
Home Financials for this Owner
Home Financials are based on the most recent Mortgage that was taken out on this home.
Original Mortgage
$116,000
Outstanding Balance
$95,029
Interest Rate
4%
Mortgage Type
New Conventional
Estimated Equity
$170,271
Purchase Details
Closed on
Jan 30, 1995
Sold by
American National Bk & Tr Co Of Chicago
Bought by
Cosmopolitan Bank & Trust and First Bank Of Oak Park
Home Financials for this Owner
Home Financials are based on the most recent Mortgage that was taken out on this home.
Original Mortgage
$75,000
Interest Rate
9.21%
Mortgage Type
Purchase Money Mortgage
Create a Home Valuation Report for This Property
The Home Valuation Report is an in-depth analysis detailing your home's value as well as a comparison with similar homes in the area
Home Values in the Area
Average Home Value in this Area
Purchase History
| Date | Buyer | Sale Price | Title Company |
|---|---|---|---|
| Labuhn Mary Ann | -- | First American Title Insuran | |
| Labuhn Mary Ann | $145,000 | Attorney | |
| Cosmopolitan Bank & Trust | $112,000 | -- |
Source: Public Records
Mortgage History
| Date | Status | Borrower | Loan Amount |
|---|---|---|---|
| Open | Labuhn Mary Ann | $116,000 | |
| Previous Owner | Cosmopolitan Bank & Trust | $75,000 |
Source: Public Records
Tax History Compared to Growth
Tax History
| Year | Tax Paid | Tax Assessment Tax Assessment Total Assessment is a certain percentage of the fair market value that is determined by local assessors to be the total taxable value of land and additions on the property. | Land | Improvement |
|---|---|---|---|---|
| 2024 | $2,964 | $71,170 | $7,713 | $63,457 |
| 2023 | $3,101 | $65,510 | $7,100 | $58,410 |
| 2022 | $3,557 | $55,930 | $6,710 | $49,220 |
| 2021 | $3,551 | $54,600 | $6,550 | $48,050 |
| 2020 | $3,514 | $54,090 | $6,490 | $47,600 |
| 2019 | $3,409 | $52,660 | $6,320 | $46,340 |
| 2018 | $2,991 | $48,350 | $5,950 | $42,400 |
| 2017 | $2,908 | $46,570 | $5,730 | $40,840 |
| 2016 | $3,310 | $44,710 | $5,500 | $39,210 |
| 2015 | $3,273 | $42,660 | $5,250 | $37,410 |
| 2014 | $3,736 | $46,430 | $5,430 | $41,000 |
| 2013 | $3,616 | $46,570 | $5,450 | $41,120 |
Source: Public Records
Map
Nearby Homes
- 462 S President St Unit 202
- 222 Shorewood Dr Unit GD
- 1111 Bloomingdale Rd Unit 2B
- 208 Shorewood Dr Unit 3-2C
- 525 Timber Ridge Dr Unit 107
- 277 Shorewood Dr Unit 2A
- 2N061 Bloomingdale Rd
- 270 Shorewood Dr Unit GA
- 1002 Spruce St Unit 2B
- 118 Windsor Ln
- 631 Belmont Ln
- 628 Belmont Ln
- 1N713 Evergreen Ave
- 373 Evergreen Cir Unit 124
- 1415 Fairway Dr
- 108 Golfview Dr
- 1445 Greens Ct
- 23W285 Armitage Ave
- 808 Bridle Ln
- 1902 N Washington St
- 118 Concord Ln Unit 34B
- 215 Concord Ln Unit 48D
- 135 Fairfield Ln Unit 135
- 883 Brompton Ct Unit 10C
- 933 Concord Ct Unit 30E
- 199 Lenox Ct Unit 40A
- 108 Concord Ln Unit B
- 196 Lenox Ct Unit B
- 161 Fairfield Ln
- 243 Concord Ln
- 192 Lenox Ct Unit 45E
- 185 Lenox Ct Unit 1
- 162 Fairfield Ln Unit 18D
- 128 Concord Ln Unit 34B
- 860 Pembrook Ct Unit 1
- 166 Fairfield Ln Unit 18E166
- 230 Concord Ln Unit 16D
- 163 Concord Ln Unit 37C
- 208 Lenox Ct
- 262 Arlington Ct Unit 262