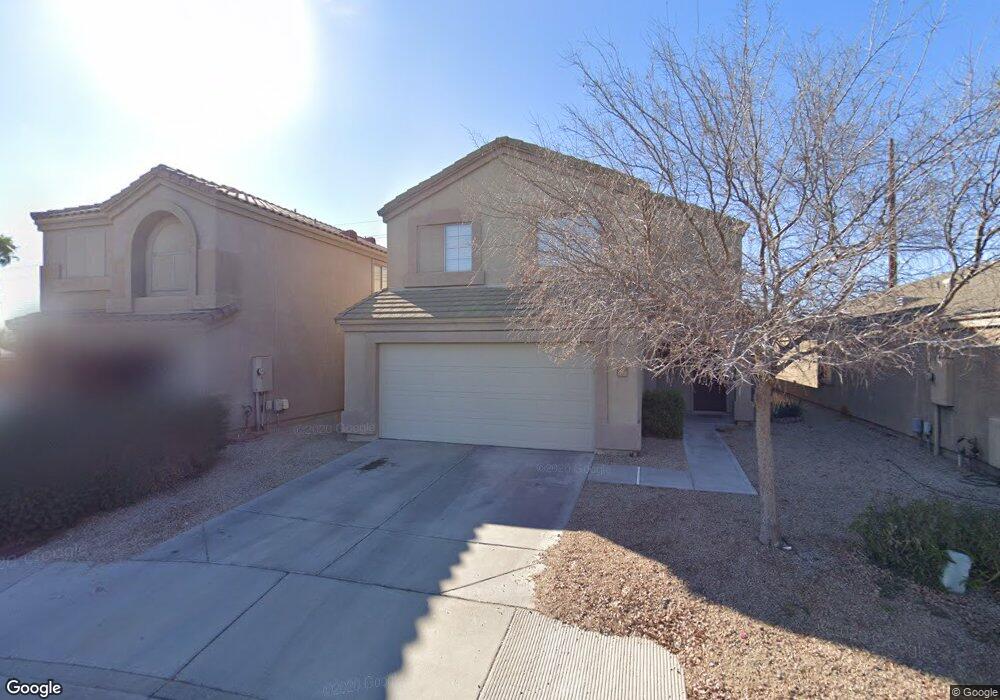
158 S Hassett Cir Mesa, AZ 85208
Northeast Mesa NeighborhoodEstimated Value: $324,182 - $400,000
4
Beds
3
Baths
1,540
Sq Ft
$235/Sq Ft
Est. Value
About This Home
This home is located at 158 S Hassett Cir, Mesa, AZ 85208 and is currently estimated at $361,796, approximately $234 per square foot. 158 S Hassett Cir is a home located in Maricopa County with nearby schools including Brinton Elementary School, Franklin at Brimhall Elementary School, and Franklin West Elementary School.
Ownership History
Date
Name
Owned For
Owner Type
Purchase Details
Closed on
Dec 20, 2017
Sold by
Starks Clarence
Bought by
Starks Clarence and Starks Gloria R
Current Estimated Value
Purchase Details
Closed on
Aug 24, 2009
Sold by
U S Bank National Association
Bought by
Starks Sara M and Starks Clarence
Home Financials for this Owner
Home Financials are based on the most recent Mortgage that was taken out on this home.
Original Mortgage
$78,400
Outstanding Balance
$51,221
Interest Rate
5.25%
Mortgage Type
New Conventional
Estimated Equity
$310,575
Purchase Details
Closed on
Apr 9, 2002
Sold by
D R Horton Inc Dietz Crane
Bought by
Barraza Rene R
Home Financials for this Owner
Home Financials are based on the most recent Mortgage that was taken out on this home.
Original Mortgage
$123,532
Interest Rate
6.78%
Mortgage Type
FHA
Create a Home Valuation Report for This Property
The Home Valuation Report is an in-depth analysis detailing your home's value as well as a comparison with similar homes in the area
Home Values in the Area
Average Home Value in this Area
Purchase History
| Date | Buyer | Sale Price | Title Company |
|---|---|---|---|
| Starks Clarence | -- | None Available | |
| Starks Clarence | -- | None Available | |
| Starks Sara M | $100,000 | Lawyers Title Insurance Corp | |
| Barraza Rene R | $125,278 | Century Title Agency Inc |
Source: Public Records
Mortgage History
| Date | Status | Borrower | Loan Amount |
|---|---|---|---|
| Open | Starks Sara M | $78,400 | |
| Previous Owner | Barraza Rene R | $123,532 |
Source: Public Records
Tax History Compared to Growth
Tax History
| Year | Tax Paid | Tax Assessment Tax Assessment Total Assessment is a certain percentage of the fair market value that is determined by local assessors to be the total taxable value of land and additions on the property. | Land | Improvement |
|---|---|---|---|---|
| 2025 | $1,168 | $11,533 | -- | -- |
| 2024 | $1,171 | $10,984 | -- | -- |
| 2023 | $1,171 | $26,750 | $5,350 | $21,400 |
| 2022 | $1,149 | $19,600 | $3,920 | $15,680 |
| 2021 | $1,158 | $17,510 | $3,500 | $14,010 |
| 2020 | $1,297 | $16,060 | $3,210 | $12,850 |
| 2019 | $1,014 | $14,600 | $2,920 | $11,680 |
| 2018 | $982 | $13,300 | $2,660 | $10,640 |
| 2017 | $924 | $12,100 | $2,420 | $9,680 |
| 2016 | $937 | $10,910 | $2,180 | $8,730 |
| 2015 | $868 | $10,110 | $2,020 | $8,090 |
Source: Public Records
Map
Nearby Homes
- 7000 E Arbor Ave
- 10856 E Arcadia Ave
- 155 S Parkwood
- 10704 E Baywood Ave
- 301 S Signal Butte Rd Unit 732
- 301 S Signal Butte Rd Unit 3
- 301 S Signal Butte Rd Unit 439
- 301 S Signal Butte Rd Unit 706
- 301 S Signal Butte Rd Unit 102
- 301 S Signal Butte Rd Unit 51
- 301 S Signal Butte Rd Unit 216
- 301 S Signal Butte Rd Unit 210
- 301 S Signal Butte Rd Unit 1116
- XXX E Compound Lot 2 D Trail Unit D
- 10936 E Apache Trail Unit 67
- 10936 E Apache Trail Unit 71
- 103 S Noble Unit 1
- 10548 E Balmoral Ave
- 10915 E Calypso Ave
- 138 N Signal Butte Rd
- 154 S Hassett Cir
- 162 S Hassett Cir
- 150 S Hassett Cir
- 146 S Hassett Cir
- 142 S Hassett Cir
- 10827 E Azalea Ave
- 138 S Hassett Cir
- 134 S Hassett
- 10835 E Azalea Ave
- 205 S Del Rancho
- 10839 E Azalea Ave
- 130 S Hassett
- 161 S Del Rancho
- 221 S Del Rancho
- 153 S Del Rancho Unit 3
- 10826 E Azalea Ave
- 219 S Del Rancho
- 10843 E Azalea Ave
- 126 S Hassett
- 10830 E Azalea Ave