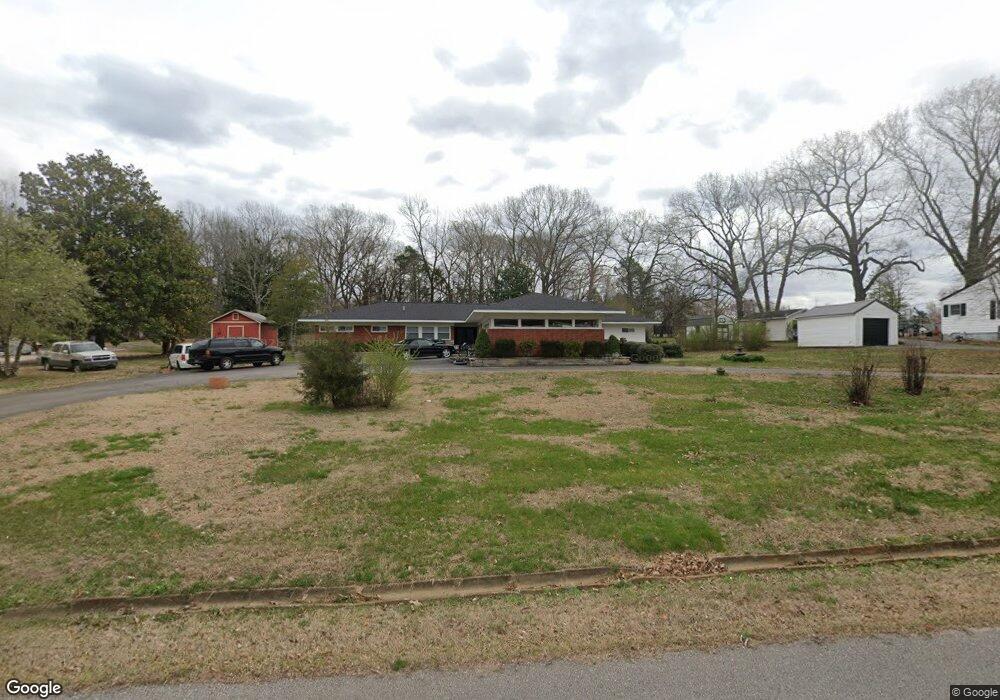
158 Westview St Camden, TN 38320
Estimated Value: $240,000 - $424,000
--
Bed
3
Baths
3,364
Sq Ft
$105/Sq Ft
Est. Value
About This Home
This home is located at 158 Westview St, Camden, TN 38320 and is currently estimated at $352,308, approximately $104 per square foot. 158 Westview St is a home located in Benton County with nearby schools including Camden Elementary School, Briarwood School, and Camden Junior High School.
Ownership History
Date
Name
Owned For
Owner Type
Purchase Details
Closed on
Aug 30, 2024
Sold by
Flowers Brandon Lynn
Bought by
Dilda Timothy D and Dilda Corazon A
Current Estimated Value
Purchase Details
Closed on
Sep 22, 2014
Sold by
Dilda Shelba Jean
Bought by
Dilda Shelba Jean and Dilda Timothy D
Purchase Details
Closed on
Jul 27, 2009
Sold by
Edwards Nancy
Bought by
Dilda Shelba Jean
Home Financials for this Owner
Home Financials are based on the most recent Mortgage that was taken out on this home.
Original Mortgage
$130,591
Interest Rate
5.36%
Mortgage Type
FHA
Purchase Details
Closed on
Feb 5, 1991
Bought by
Johnson Ida Mae
Purchase Details
Closed on
Mar 16, 1989
Bought by
Brown Buford Cordell and Brown Shelia M
Purchase Details
Closed on
Apr 14, 1987
Bought by
Cary Wesley and Cary Linda J
Create a Home Valuation Report for This Property
The Home Valuation Report is an in-depth analysis detailing your home's value as well as a comparison with similar homes in the area
Home Values in the Area
Average Home Value in this Area
Purchase History
| Date | Buyer | Sale Price | Title Company |
|---|---|---|---|
| Dilda Timothy D | $55,000 | None Listed On Document | |
| Dilda Shelba Jean | -- | -- | |
| Dilda Shelba Jean | $133,000 | -- | |
| Johnson Ida Mae | $85,000 | -- | |
| Brown Buford Cordell | $79,000 | -- | |
| Cary Wesley | -- | -- | |
| Dilda Shelba Jean | $133,000 | -- |
Source: Public Records
Mortgage History
| Date | Status | Borrower | Loan Amount |
|---|---|---|---|
| Previous Owner | Cary Wesley | $130,591 |
Source: Public Records
Tax History Compared to Growth
Tax History
| Year | Tax Paid | Tax Assessment Tax Assessment Total Assessment is a certain percentage of the fair market value that is determined by local assessors to be the total taxable value of land and additions on the property. | Land | Improvement |
|---|---|---|---|---|
| 2025 | -- | $102,600 | $0 | $0 |
| 2024 | -- | $69,075 | $6,250 | $62,825 |
| 2023 | $2,532 | $69,075 | $6,250 | $62,825 |
| 2022 | $2,007 | $54,750 | $6,250 | $48,500 |
| 2021 | $2,007 | $66,575 | $6,250 | $60,325 |
| 2020 | $2,442 | $66,575 | $6,250 | $60,325 |
| 2019 | $1,616 | $40,900 | $6,250 | $34,650 |
| 2018 | $1,616 | $40,900 | $6,250 | $34,650 |
| 2017 | $1,616 | $40,900 | $6,250 | $34,650 |
| 2016 | $1,473 | $40,900 | $6,250 | $34,650 |
| 2015 | $1,487 | $37,275 | $6,250 | $31,025 |
| 2014 | $1,430 | $37,275 | $6,250 | $31,025 |
| 2013 | $1,430 | $36,291 | $0 | $0 |
Source: Public Records
Map
Nearby Homes
- 166 Westview St
- 144 Post Oak Ave
- 180 Post Oak Ave
- 107 Melton Ave
- 172 W Main St
- 103 Highway 641 N
- 156 W Main St
- 77 Highway 641 S
- 121 Washington Ave
- 1 Post Oak Rd
- 122 W Lake St
- 1 Maple Ave
- 335 Mount Carmel Rd
- 1762 Washington Ave
- 136 N Forrest Ave
- 3295 Mount Carmel Rd
- 186 N Forrest Ave
- 121 Davidson St
- 116 N Church Ave
- 000 Laveta Ln
- 160 Westview St
- 156 Westview St
- 162 Westview St
- 234 Watson St
- 242 Watson St
- 230 Watson St
- 161 Westview St
- 155 Westview St
- 1581/2 Westview Ave
- 166 Westview Ave
- 226 Watson St
- 246 Watson St
- 165 Westview St
- 169 Westview St
- 222 Watson St
- 151 Westview St
- 170 Westview St
- 218 Watson St
- 173 Westview St
- 147 Westview St