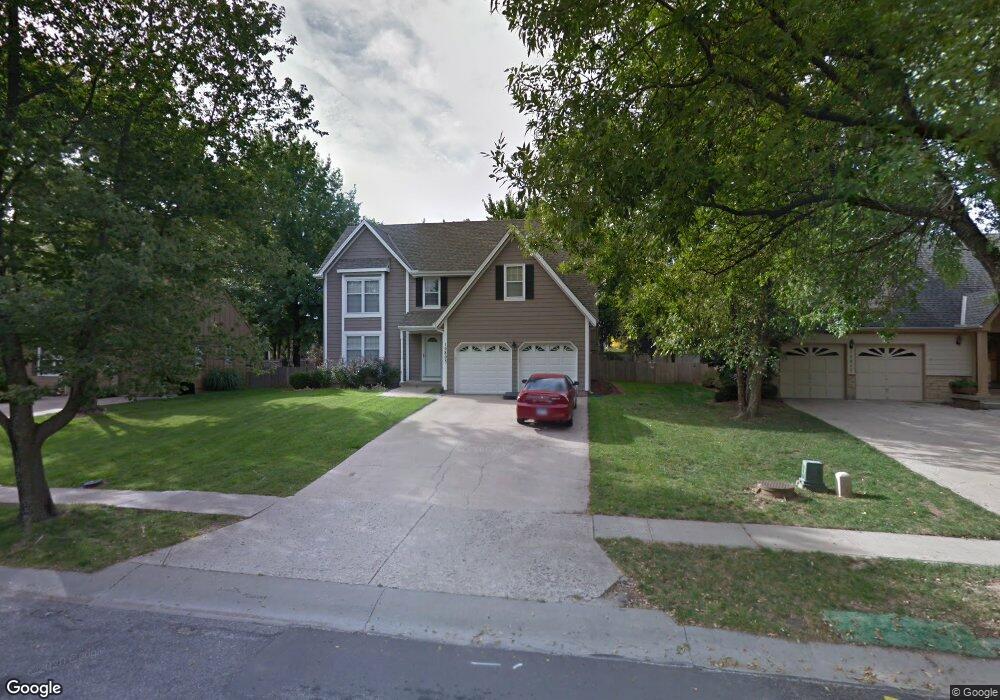
15803 W 81st St Lenexa, KS 66219
Estimated Value: $434,052 - $468,000
4
Beds
3
Baths
2,178
Sq Ft
$205/Sq Ft
Est. Value
About This Home
This home is located at 15803 W 81st St, Lenexa, KS 66219 and is currently estimated at $447,263, approximately $205 per square foot. 15803 W 81st St is a home located in Johnson County with nearby schools including Christa McAuliffe Elementary School, Westridge Middle School, and Shawnee Mission West High School.
Ownership History
Date
Name
Owned For
Owner Type
Purchase Details
Closed on
Dec 11, 2020
Sold by
Hawkins Robert E and Hawkins Nancianne K
Bought by
Hotujac Michael and Hotujac Danielle
Current Estimated Value
Purchase Details
Closed on
Dec 17, 2009
Sold by
Amparan Andrew Joseph and Amparan Beverly Jean
Bought by
Amparan Andrew Joseph and Amparan Beverly Jean
Home Financials for this Owner
Home Financials are based on the most recent Mortgage that was taken out on this home.
Original Mortgage
$145,000
Interest Rate
4.37%
Mortgage Type
New Conventional
Purchase Details
Closed on
Mar 17, 2005
Sold by
Amparan Andrew J and Amparan Beverly J
Bought by
Amparan Andrew Joseph and Amparan Beverly Jean
Create a Home Valuation Report for This Property
The Home Valuation Report is an in-depth analysis detailing your home's value as well as a comparison with similar homes in the area
Home Values in the Area
Average Home Value in this Area
Purchase History
| Date | Buyer | Sale Price | Title Company |
|---|---|---|---|
| Hotujac Michael | -- | Continental Title Company | |
| Amparan Andrew Joseph | -- | Chicago Title Insurance Co | |
| Amparan Andrew Joseph | -- | None Available |
Source: Public Records
Mortgage History
| Date | Status | Borrower | Loan Amount |
|---|---|---|---|
| Previous Owner | Amparan Andrew Joseph | $145,000 |
Source: Public Records
Tax History Compared to Growth
Tax History
| Year | Tax Paid | Tax Assessment Tax Assessment Total Assessment is a certain percentage of the fair market value that is determined by local assessors to be the total taxable value of land and additions on the property. | Land | Improvement |
|---|---|---|---|---|
| 2024 | $4,918 | $44,459 | $10,150 | $34,309 |
| 2023 | $4,836 | $42,964 | $9,229 | $33,735 |
| 2022 | $4,248 | $37,697 | $8,387 | $29,310 |
| 2021 | $4,012 | $33,764 | $7,626 | $26,138 |
| 2020 | $3,883 | $32,350 | $7,626 | $24,724 |
| 2019 | $3,332 | $27,680 | $5,298 | $22,382 |
| 2018 | $3,446 | $28,405 | $5,298 | $23,107 |
| 2017 | $3,469 | $27,727 | $4,820 | $22,907 |
| 2016 | $3,279 | $25,864 | $4,385 | $21,479 |
| 2015 | $3,119 | $24,760 | $4,385 | $20,375 |
| 2013 | -- | $22,230 | $4,385 | $17,845 |
Source: Public Records
Map
Nearby Homes
- 15615 W 81st St
- 8033 Hall St
- 15529 W 83rd Terrace
- 15322 W 83rd St
- 15710 W 84th Terrace
- 15322 W 83rd Terrace
- 8403 Swarner Dr
- 15611 W 86th St
- 14915 W 84th Terrace
- 14828 W 83rd Place
- 8616 Baska Ct
- 16809 W 83rd St
- 7621 Lichtenauer Dr
- 14620 W 84th St
- 14424 W 84th Terrace
- 7219 Allman Rd
- 7239 Allman Rd
- 7221 Allman Rd
- 7237 Allman Rd
- 7231 Allman Rd
- 15737 W 81st St
- 15809 W 81st St
- 15731 W 81st St
- 8066 Lakeview Ave
- 15732 W 81st St
- 15725 W 81st St
- 8062 Lakeview Ave
- 15726 W 81st St
- 8133 Schweiger Dr
- 15719 W 81st St
- 8137 Schweiger Dr
- 8058 Lakeview Ave
- 8073 Hall St
- 15720 W 81st St
- 8207 Schweiger Dr
- 8129 Schweiger Dr
- 8071 Hall St
- 15713 W 81st St
- 8054 Lakeview Ave
- 8211 Schweiger Dr