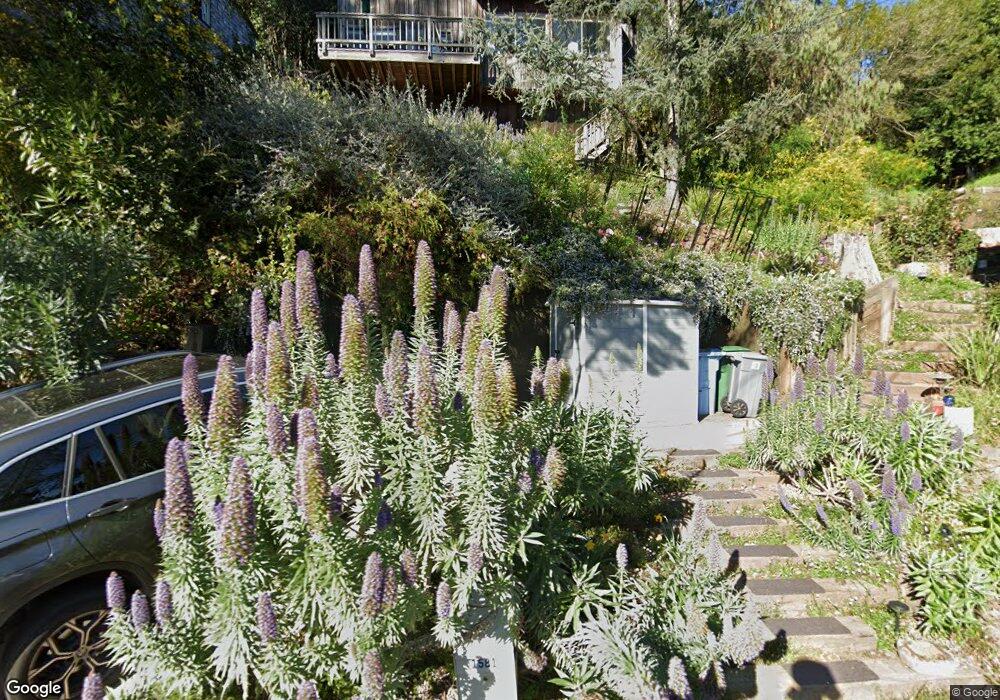
1581 Campus Dr Berkeley, CA 94708
Berkeley Hills NeighborhoodEstimated Value: $1,453,000 - $1,591,529
3
Beds
2
Baths
2,054
Sq Ft
$738/Sq Ft
Est. Value
About This Home
This home is located at 1581 Campus Dr, Berkeley, CA 94708 and is currently estimated at $1,515,882, approximately $738 per square foot. 1581 Campus Dr is a home located in Alameda County with nearby schools including Berkeley Arts Magnet at Whittier School, Cragmont Elementary School, and Washington Elementary School.
Ownership History
Date
Name
Owned For
Owner Type
Purchase Details
Closed on
Oct 27, 2010
Sold by
Oconnell Katrina and Eisenstadt Katrina A
Bought by
Yeh James C
Current Estimated Value
Home Financials for this Owner
Home Financials are based on the most recent Mortgage that was taken out on this home.
Original Mortgage
$540,000
Outstanding Balance
$357,372
Interest Rate
4.33%
Mortgage Type
New Conventional
Estimated Equity
$1,158,510
Purchase Details
Closed on
Jun 2, 2000
Sold by
Sedman Johanna and Packard Andrew
Bought by
Eisenstadt Katrina A
Home Financials for this Owner
Home Financials are based on the most recent Mortgage that was taken out on this home.
Original Mortgage
$420,000
Interest Rate
8.5%
Create a Home Valuation Report for This Property
The Home Valuation Report is an in-depth analysis detailing your home's value as well as a comparison with similar homes in the area
Home Values in the Area
Average Home Value in this Area
Purchase History
| Date | Buyer | Sale Price | Title Company |
|---|---|---|---|
| Yeh James C | $675,000 | Chicago Title Company | |
| Eisenstadt Katrina A | $525,000 | First American Title Guarant |
Source: Public Records
Mortgage History
| Date | Status | Borrower | Loan Amount |
|---|---|---|---|
| Open | Yeh James C | $540,000 | |
| Previous Owner | Eisenstadt Katrina A | $420,000 | |
| Closed | Eisenstadt Katrina A | $25,000 |
Source: Public Records
Tax History
| Year | Tax Paid | Tax Assessment Tax Assessment Total Assessment is a certain percentage of the fair market value that is determined by local assessors to be the total taxable value of land and additions on the property. | Land | Improvement |
|---|---|---|---|---|
| 2025 | $16,515 | $857,741 | $259,422 | $605,319 |
| 2024 | $16,515 | $840,792 | $254,337 | $593,455 |
| 2023 | $16,135 | $831,174 | $249,352 | $581,822 |
| 2022 | $15,759 | $807,880 | $244,464 | $570,416 |
| 2021 | $15,747 | $791,902 | $239,670 | $559,232 |
| 2020 | $14,661 | $790,714 | $237,214 | $553,500 |
| 2019 | $13,829 | $775,217 | $232,565 | $542,652 |
| 2018 | $13,546 | $760,022 | $228,006 | $532,016 |
| 2017 | $13,078 | $745,125 | $223,537 | $521,588 |
| 2016 | $12,496 | $730,518 | $219,155 | $511,363 |
| 2015 | $12,303 | $719,550 | $215,865 | $503,685 |
| 2014 | $12,103 | $705,455 | $211,636 | $493,819 |
Source: Public Records
Map
Nearby Homes
- 230 Fairlawn Dr
- 1375 Queens Rd
- 1698 La Loma Ave Unit 1698
- 2700 Le Conte Ave Unit 301
- 2700 Le Conte Ave Unit 402
- 2634 Virginia St Unit 33
- 2600 Hilgard Ave
- 2686 Shasta Rd
- 1221 Grizzly Peak Blvd
- 2501 Rose Walk
- 2477 Virginia St
- 1160 Miller Ave
- 1155 Keeler Ave
- 1165 Cragmont Ave
- 2451 Le Conte Ave
- 2421 Hilgard Ave
- 1110 Sterling Ave
- 39 Canyon Rd
- 1622 Scenic Ave
- 0 Panoramic Way Unit 41118724
- 1577 Campus Dr
- 1585 Campus Dr
- 1544 Olympus Ave
- 1566 Olympus Ave
- 1536 Olympus Ave
- 1589 Campus Dr
- 1575 Campus Dr
- 1570 Olympus Ave
- 1588 Campus Dr
- 1530 Olympus Ave
- 1520 Olympus Ave
- 1569 Campus Dr
- 1516 Olympus Ave
- 1590 Campus Dr
- 1572 Olympus Ave
- 1510 Olympus Ave
- 1580 Olympus Ave
- 1568 Campus Dr
- 1566 Campus Dr
- 1504 Olympus Ave
Your Personal Tour Guide
Ask me questions while you tour the home.