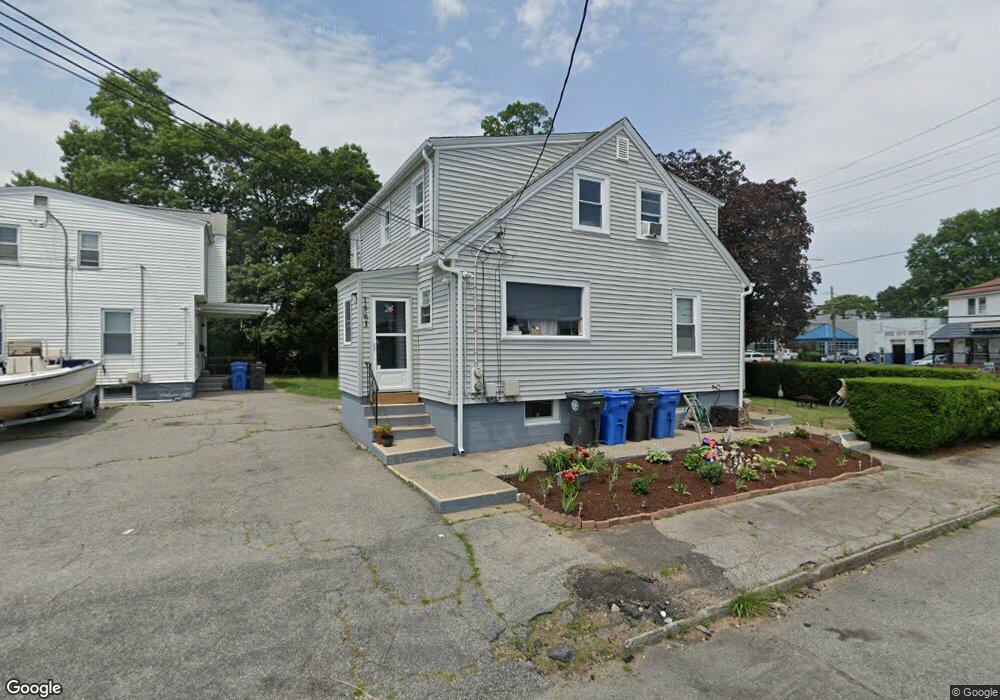
1581 Elmwood Ave Unit 2 Cranston, RI 02910
Park View NeighborhoodEstimated Value: $432,000 - $502,000
2
Beds
1
Bath
810
Sq Ft
$572/Sq Ft
Est. Value
About This Home
This home is located at 1581 Elmwood Ave Unit 2, Cranston, RI 02910 and is currently estimated at $463,125, approximately $571 per square foot. 1581 Elmwood Ave Unit 2 is a home located in Providence County with nearby schools including Edgewood Highland Elementary School, Edward S. Rhodes School, and Park View Middle School.
Ownership History
Date
Name
Owned For
Owner Type
Purchase Details
Closed on
May 7, 2024
Sold by
Fort Prop Llc
Bought by
Paula Amalia Y and Rodriguez Louis N
Current Estimated Value
Home Financials for this Owner
Home Financials are based on the most recent Mortgage that was taken out on this home.
Original Mortgage
$439,885
Outstanding Balance
$433,300
Interest Rate
6.87%
Mortgage Type
FHA
Estimated Equity
$29,825
Purchase Details
Closed on
Oct 6, 2020
Sold by
D E Land Co Llc
Bought by
Ewell Ft and Well
Purchase Details
Closed on
Nov 26, 2013
Sold by
Magnone Richard P and Magnone John E
Bought by
Elwell Maynard D
Create a Home Valuation Report for This Property
The Home Valuation Report is an in-depth analysis detailing your home's value as well as a comparison with similar homes in the area
Home Values in the Area
Average Home Value in this Area
Purchase History
| Date | Buyer | Sale Price | Title Company |
|---|---|---|---|
| Paula Amalia Y | $448,000 | None Available | |
| Paula Amalia Y | $448,000 | None Available | |
| Ewell Ft | -- | None Available | |
| Ewell Ft | -- | None Available | |
| Elwell Maynard D | $150,000 | -- | |
| Magnone John E | -- | -- | |
| Magnone John E | -- | -- |
Source: Public Records
Mortgage History
| Date | Status | Borrower | Loan Amount |
|---|---|---|---|
| Open | Paula Amalia Y | $439,885 | |
| Closed | Paula Amalia Y | $439,885 |
Source: Public Records
Tax History Compared to Growth
Tax History
| Year | Tax Paid | Tax Assessment Tax Assessment Total Assessment is a certain percentage of the fair market value that is determined by local assessors to be the total taxable value of land and additions on the property. | Land | Improvement |
|---|---|---|---|---|
| 2025 | $5,018 | $361,500 | $114,200 | $247,300 |
| 2024 | $4,807 | $353,200 | $105,900 | $247,300 |
| 2023 | $3,678 | $194,600 | $46,500 | $148,100 |
| 2022 | $3,602 | $194,600 | $46,500 | $148,100 |
| 2021 | $3,503 | $194,600 | $46,500 | $148,100 |
| 2020 | $3,194 | $153,800 | $36,500 | $117,300 |
| 2019 | $3,194 | $153,800 | $36,500 | $117,300 |
| 2018 | $3,121 | $153,800 | $36,500 | $117,300 |
| 2017 | $2,443 | $106,500 | $16,600 | $89,900 |
| 2016 | $2,391 | $106,500 | $16,600 | $89,900 |
| 2015 | $2,391 | $106,500 | $16,600 | $89,900 |
| 2014 | $2,538 | $111,100 | $16,600 | $94,500 |
Source: Public Records
Map
Nearby Homes