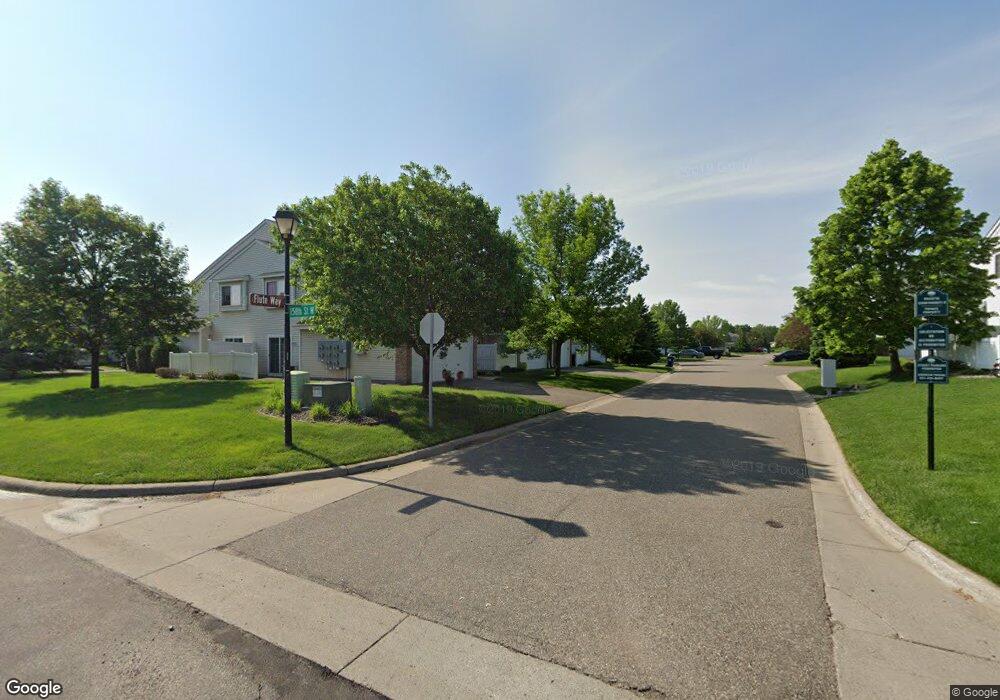
15810 Flute Way Saint Paul, MN 55124
Galaxie Commons NeighborhoodEstimated Value: $250,149 - $259,000
2
Beds
2
Baths
1,260
Sq Ft
$202/Sq Ft
Est. Value
About This Home
This home is located at 15810 Flute Way, Saint Paul, MN 55124 and is currently estimated at $254,787, approximately $202 per square foot. 15810 Flute Way is a home located in Dakota County with nearby schools including Parkview Elementary School, Scott Highlands Middle School, and Rosemount Senior High School.
Ownership History
Date
Name
Owned For
Owner Type
Purchase Details
Closed on
Aug 10, 2016
Sold by
Silwal Subas and Silwal Anjana
Bought by
Neupane Krishna Raj
Current Estimated Value
Home Financials for this Owner
Home Financials are based on the most recent Mortgage that was taken out on this home.
Original Mortgage
$127,920
Outstanding Balance
$102,065
Interest Rate
3.48%
Mortgage Type
New Conventional
Estimated Equity
$152,722
Purchase Details
Closed on
May 26, 2006
Sold by
Crowden David F and Crowden Peggy M
Bought by
Silwal Subas
Purchase Details
Closed on
Oct 27, 2004
Sold by
Starzecki Jason T and Starzecki Devon R
Bought by
Crowden Peggy M and Crowden David F
Purchase Details
Closed on
Feb 28, 2002
Sold by
Pulte Homes Of Minnesota Corp
Bought by
Geiger Devon R
Create a Home Valuation Report for This Property
The Home Valuation Report is an in-depth analysis detailing your home's value as well as a comparison with similar homes in the area
Home Values in the Area
Average Home Value in this Area
Purchase History
| Date | Buyer | Sale Price | Title Company |
|---|---|---|---|
| Neupane Krishna Raj | $159,900 | Pillar Title Services | |
| Silwal Subas | $173,000 | -- | |
| Crowden Peggy M | $172,500 | -- | |
| Geiger Devon R | $147,020 | -- |
Source: Public Records
Mortgage History
| Date | Status | Borrower | Loan Amount |
|---|---|---|---|
| Open | Neupane Krishna Raj | $127,920 |
Source: Public Records
Tax History Compared to Growth
Tax History
| Year | Tax Paid | Tax Assessment Tax Assessment Total Assessment is a certain percentage of the fair market value that is determined by local assessors to be the total taxable value of land and additions on the property. | Land | Improvement |
|---|---|---|---|---|
| 2024 | $2,488 | $240,000 | $54,300 | $185,700 |
| 2023 | $2,488 | $231,100 | $53,100 | $178,000 |
| 2022 | $2,116 | $227,300 | $53,000 | $174,300 |
| 2021 | $1,966 | $195,700 | $46,300 | $149,400 |
| 2020 | $1,998 | $180,000 | $44,100 | $135,900 |
| 2019 | $1,725 | $177,700 | $42,000 | $135,700 |
| 2018 | $1,842 | $163,700 | $38,900 | $124,800 |
| 2017 | $1,673 | $149,500 | $36,000 | $113,500 |
| 2016 | $1,589 | $147,200 | $34,300 | $112,900 |
| 2015 | $1,399 | $115,251 | $27,680 | $87,571 |
| 2014 | -- | $101,626 | $24,728 | $76,898 |
| 2013 | -- | $95,522 | $21,881 | $73,641 |
Source: Public Records
Map
Nearby Homes
- 15973 Flotilla Trail Unit 300
- 15792 Flan Ct
- 6760 158th St W
- 6744 Foliage Ct W
- 6414 158th St W Unit 201
- 6406 157th St W
- 16123 Flagstaff Ct N
- 6456 157th St W
- 15725 France Way Unit 1416
- 6852 161st St W
- 15823 Freedom Ln
- 15854 Frisian Ln
- 6869 Folkestone Rd Unit 614
- 15822 Frisian Ln
- 15681 Flackwood Way
- 6634 162nd Ct Unit 421
- 15675 Flackwood Way
- 15649 Flackwood Way
- 15521 Foghorn Ln
- 15529 Foghorn Ln Unit 204
- 15810 Flute Way Unit 247
- 15828 Fleet Trail
- 15808 Flute Way Unit 248
- 15826 Fleet Trail Unit 245
- 15824 Fleet Trail
- 15824 Fleet Trail Unit 244
- 15806 Flute Way Unit 249
- 15822 Fleet Trail Unit 243
- 15827 Fleet Trail Unit 255
- 15829 Fleet Trail
- 15831 Fleet Trail
- 15831 Fleet Trail Unit 257
- 15926 Flotilla Trail
- 15928 Flotilla Trail Unit 253
- 15836 Fleet Trail
- 15834 Fleet Trail
- 15820 Fleet Trail Unit 235
- 15821 Fleet Trail
- 15833 Fleet Trail
- 15930 Flotilla Trail