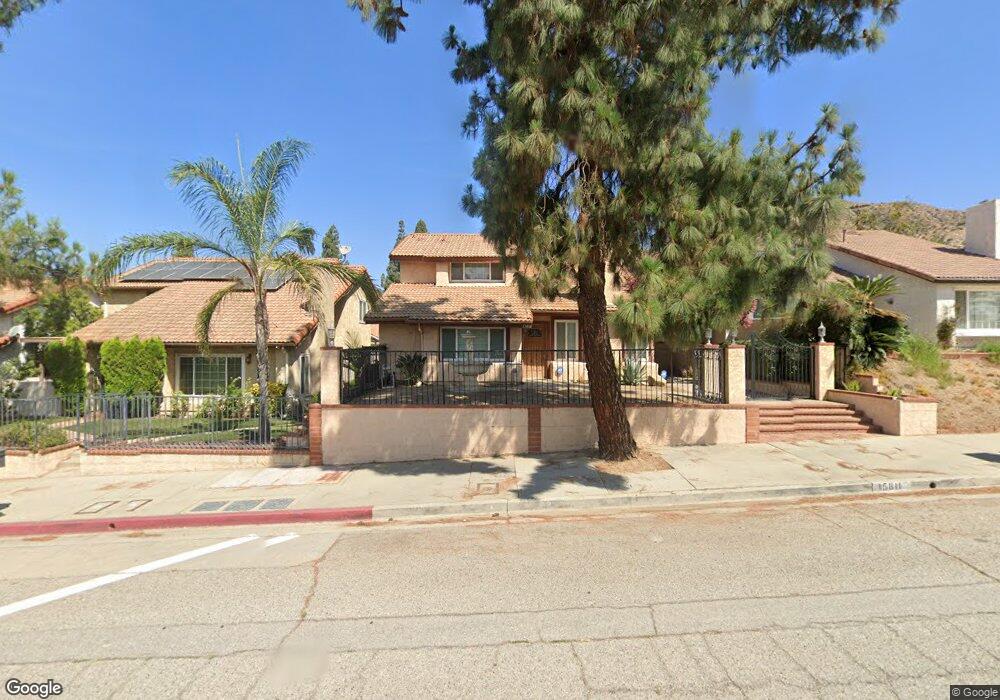
15811 Foothill Blvd Sylmar, CA 91342
Estimated Value: $748,257 - $869,000
3
Beds
3
Baths
1,762
Sq Ft
$457/Sq Ft
Est. Value
About This Home
This home is located at 15811 Foothill Blvd, Sylmar, CA 91342 and is currently estimated at $806,064, approximately $457 per square foot. 15811 Foothill Blvd is a home located in Los Angeles County with nearby schools including Herrick Avenue Elementary School, Olive Vista Middle School, and San Fernando Senior High School.
Ownership History
Date
Name
Owned For
Owner Type
Purchase Details
Closed on
Sep 25, 2015
Sold by
Valdez Irma
Bought by
Reyes Kubota Irma and Irma Reyes Kubota Living Trust
Current Estimated Value
Purchase Details
Closed on
Aug 7, 1998
Sold by
Morgan Ernest B and The Ernest B Morgan Family Tru
Bought by
Valdez Irma
Home Financials for this Owner
Home Financials are based on the most recent Mortgage that was taken out on this home.
Original Mortgage
$164,350
Interest Rate
6.91%
Purchase Details
Closed on
Aug 2, 1995
Sold by
Morgan Ernest Brad and Morgan Nicole Denise
Bought by
Morgan Ernest B and Morgan Nicole D
Home Financials for this Owner
Home Financials are based on the most recent Mortgage that was taken out on this home.
Original Mortgage
$40,000
Interest Rate
7.63%
Mortgage Type
Seller Take Back
Create a Home Valuation Report for This Property
The Home Valuation Report is an in-depth analysis detailing your home's value as well as a comparison with similar homes in the area
Home Values in the Area
Average Home Value in this Area
Purchase History
| Date | Buyer | Sale Price | Title Company |
|---|---|---|---|
| Reyes Kubota Irma | -- | None Available | |
| Valdez Irma | $173,000 | Southland Title Corporation | |
| Morgan Ernest B | -- | -- | |
| Morgan Ernest Brad | -- | -- |
Source: Public Records
Mortgage History
| Date | Status | Borrower | Loan Amount |
|---|---|---|---|
| Previous Owner | Valdez Irma | $164,350 | |
| Previous Owner | Morgan Ernest Brad | $40,000 |
Source: Public Records
Tax History Compared to Growth
Tax History
| Year | Tax Paid | Tax Assessment Tax Assessment Total Assessment is a certain percentage of the fair market value that is determined by local assessors to be the total taxable value of land and additions on the property. | Land | Improvement |
|---|---|---|---|---|
| 2025 | $3,452 | $271,187 | $81,507 | $189,680 |
| 2024 | $3,452 | $265,870 | $79,909 | $185,961 |
| 2023 | $3,389 | $260,658 | $78,343 | $182,315 |
| 2022 | $3,237 | $255,548 | $76,807 | $178,741 |
| 2021 | $3,189 | $250,538 | $75,301 | $175,237 |
| 2020 | $3,216 | $247,970 | $74,529 | $173,441 |
| 2019 | $3,133 | $243,109 | $73,068 | $170,041 |
| 2018 | $3,000 | $238,343 | $71,636 | $166,707 |
| 2016 | $2,849 | $229,090 | $68,855 | $160,235 |
| 2015 | $2,809 | $225,650 | $67,821 | $157,829 |
| 2014 | $2,824 | $221,231 | $66,493 | $154,738 |
Source: Public Records
Map
Nearby Homes
- 15574 Sorbonne St
- 13775 Glenoaks Blvd Unit 16
- 15873 Yarnell St
- 13800 Glenoaks Blvd
- 16079 Yarnell St Unit B18
- 15831 Olden St Unit 63
- 13575 De Garmo Ave
- 15232 Foothill Blvd Unit 111
- 16121 Filbert St
- 15455 Glenoaks Blvd Unit 46
- 15455 Glenoaks Blvd Unit 507
- 15455 Glenoaks Blvd Unit 94
- 15455 Glenoaks Blvd Unit 226
- 15455 Glenoaks Blvd Unit 502
- 15455 Glenoaks Blvd Unit 146
- 15455 Glenoaks Blvd Unit 557
- 15455 Glenoaks Blvd Unit 299
- 15245 Monte St
- 13346 Los Olivos Rd
- 13522 Glenoaks Blvd Unit 4
- 15821 Foothill Blvd
- 15737 Foothill Blvd
- 15741 Foothill Blvd
- 15745 Foothill Blvd
- 15749 Foothill Blvd
- 15801 Foothill Blvd
- 15805 Foothill Blvd
- 15815 Foothill Blvd
- 15755 Foothill Blvd Unit 6
- 15806 Joseph Ct
- 15814 Joseph Ct
- 15818 Joseph Ct
- 15822 Joseph Ct
- 15802 Joseph Ct Unit 6
- 15802 Joseph Ct
- 15810 Joseph Ct
- 15551 Sorbonne St
- 15729 Foothill Blvd
- 15550 Sorbonne St
- 15553 Sorbonne St