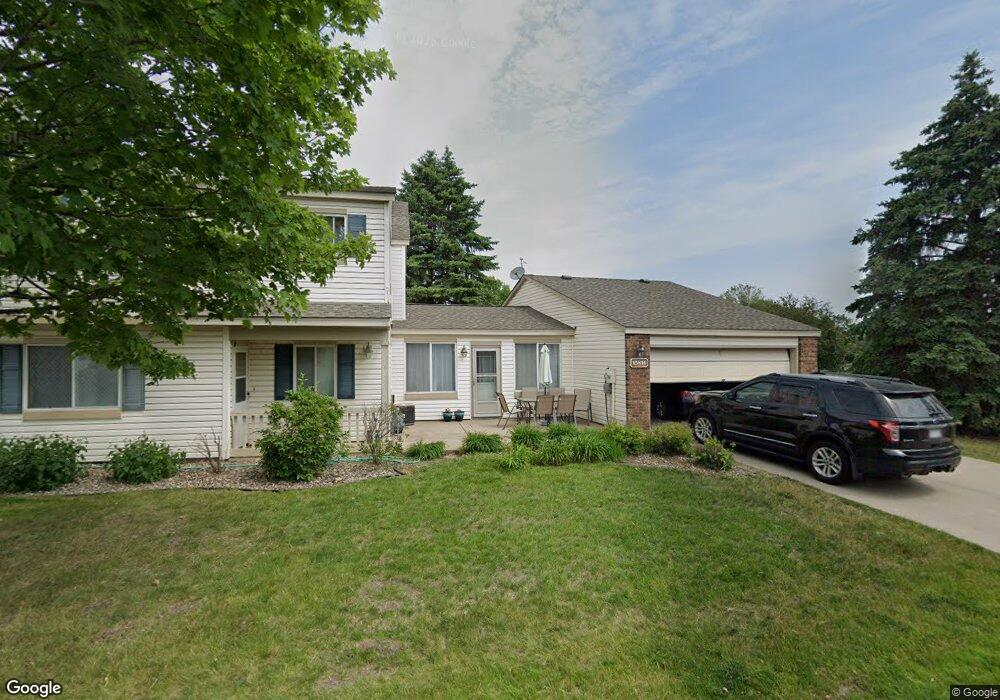
15814 Griffon Path Saint Paul, MN 55124
Old Town NeighborhoodEstimated Value: $264,211 - $275,000
3
Beds
3
Baths
1,316
Sq Ft
$205/Sq Ft
Est. Value
About This Home
This home is located at 15814 Griffon Path, Saint Paul, MN 55124 and is currently estimated at $270,303, approximately $205 per square foot. 15814 Griffon Path is a home located in Dakota County with nearby schools including Cedar Park Elementary STEM School, Valley Middle School, and Apple Valley Senior High School.
Ownership History
Date
Name
Owned For
Owner Type
Purchase Details
Closed on
Jun 23, 2017
Sold by
Lange Kathy Lee and Meuwissen Kathy Lee
Bought by
Tesgera Isayas L and Bedasso Wesene A
Current Estimated Value
Home Financials for this Owner
Home Financials are based on the most recent Mortgage that was taken out on this home.
Original Mortgage
$100,000
Outstanding Balance
$83,420
Interest Rate
3.95%
Mortgage Type
Unknown
Estimated Equity
$186,883
Purchase Details
Closed on
Jul 16, 2007
Sold by
Thayer Sean Thomas and Thayer Jennifer Lee
Bought by
Smith Megan
Home Financials for this Owner
Home Financials are based on the most recent Mortgage that was taken out on this home.
Original Mortgage
$179,900
Interest Rate
6.76%
Mortgage Type
New Conventional
Purchase Details
Closed on
Jun 24, 2004
Sold by
Kolehmainen Susan M and Kolehmainen Jeffrey A
Bought by
Thayer Sean T and Thayer Jennifer I
Purchase Details
Closed on
Aug 15, 2000
Sold by
Hulbert Deborah Ann
Bought by
Kolehmainen Susan M and Kolehmainen Jeffrey A
Create a Home Valuation Report for This Property
The Home Valuation Report is an in-depth analysis detailing your home's value as well as a comparison with similar homes in the area
Home Values in the Area
Average Home Value in this Area
Purchase History
| Date | Buyer | Sale Price | Title Company |
|---|---|---|---|
| Tesgera Isayas L | $186,000 | Edina Realty Title Inc | |
| Smith Megan | $179,900 | -- | |
| Thayer Sean T | $174,900 | -- | |
| Kolehmainen Susan M | $133,000 | -- |
Source: Public Records
Mortgage History
| Date | Status | Borrower | Loan Amount |
|---|---|---|---|
| Open | Tesgera Isayas L | $100,000 | |
| Previous Owner | Tesgera Isayas L | $180,420 | |
| Previous Owner | Smith Megan | $179,900 |
Source: Public Records
Tax History Compared to Growth
Tax History
| Year | Tax Paid | Tax Assessment Tax Assessment Total Assessment is a certain percentage of the fair market value that is determined by local assessors to be the total taxable value of land and additions on the property. | Land | Improvement |
|---|---|---|---|---|
| 2024 | $2,810 | $256,500 | $49,100 | $207,400 |
| 2023 | $2,810 | $257,700 | $48,000 | $209,700 |
| 2022 | $2,256 | $240,900 | $47,900 | $193,000 |
| 2021 | $2,146 | $207,100 | $41,600 | $165,500 |
| 2020 | $2,144 | $194,300 | $39,700 | $154,600 |
| 2019 | $1,836 | $188,900 | $37,800 | $151,100 |
| 2018 | $1,766 | $172,500 | $35,000 | $137,500 |
| 2017 | $1,637 | $160,800 | $32,400 | $128,400 |
| 2016 | $1,592 | $144,600 | $30,800 | $113,800 |
| 2015 | $1,393 | $115,469 | $24,891 | $90,578 |
| 2014 | -- | $101,081 | $22,223 | $78,858 |
| 2013 | -- | $89,963 | $19,349 | $70,614 |
Source: Public Records
Map
Nearby Homes
- 15722 Griffon Ct
- 7765 157th St W
- 15887 Griffon Path
- 8090 159th St W
- 7616 157th St W Unit D
- 7600 157th St W Unit 105
- 16096 Harmony Path
- 16246 Godson Cir
- 889 Whitney Dr
- 16276 Greenbriar Ct
- 841 Cortland Dr
- 15979 Harwell Ave
- 16377 Greenbriar Ct
- 834 Fireside Dr
- 921 Cortland Dr S
- 16371 Harmony Path
- 16365 Gladiola Ave W
- 15511 Gateway Path Unit 132
- 16413 Godson Dr
- 15503 Gateway Path Unit 128
- 15806 Griffon Path
- 15812 Griffon Path
- 15822 Griffon Path
- 15804 Griffon Path
- 15820 Griffon Path
- 15810 Griffon Path
- 15830 Griffon Path
- 15828 Griffon Path
- 15802 Griffon Path
- 15818 Griffon Path
- 15826 Griffon Path
- 7746 157th St W
- 7738 157th St W
- 15808 Griffon Path
- 15838 Griffon Path
- 15836 Griffon Path
- 15740 Griffon Path
- 15800 Griffon Path
- 15816 Griffon Path
- 7730 157th St W