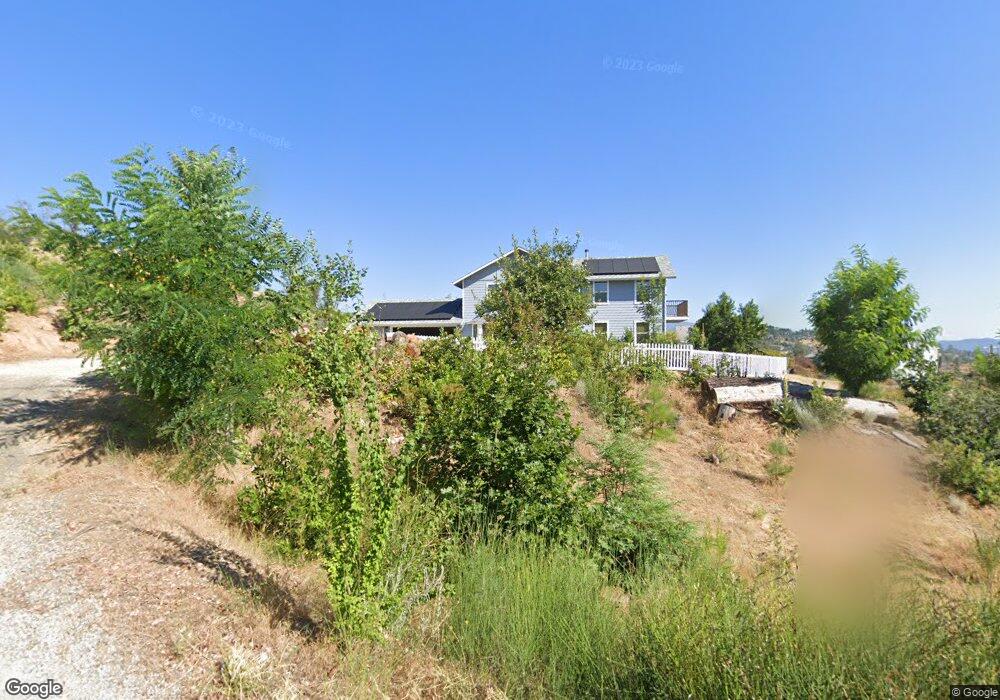
15828 Clodhopper Dr Redding, CA 96001
Shasta NeighborhoodEstimated Value: $362,000 - $478,000
3
Beds
3
Baths
2,086
Sq Ft
$213/Sq Ft
Est. Value
About This Home
This home is located at 15828 Clodhopper Dr, Redding, CA 96001 and is currently estimated at $445,187, approximately $213 per square foot. 15828 Clodhopper Dr is a home located in Shasta County with nearby schools including Shasta Elementary School and Shasta High School.
Ownership History
Date
Name
Owned For
Owner Type
Purchase Details
Closed on
Sep 13, 2007
Sold by
Hartig Debra J
Bought by
Eppley David A and Hartig Debra J
Current Estimated Value
Purchase Details
Closed on
Nov 3, 1999
Sold by
Sherer Randall B and Sherer Beverley J
Bought by
Hartig Debra J
Home Financials for this Owner
Home Financials are based on the most recent Mortgage that was taken out on this home.
Original Mortgage
$155,200
Outstanding Balance
$47,127
Interest Rate
7.68%
Estimated Equity
$398,060
Purchase Details
Closed on
May 1, 1998
Sold by
Sousa Douglas H
Bought by
Sherer Randall B and Sherer Beverley J
Home Financials for this Owner
Home Financials are based on the most recent Mortgage that was taken out on this home.
Original Mortgage
$10,000
Interest Rate
7.13%
Create a Home Valuation Report for This Property
The Home Valuation Report is an in-depth analysis detailing your home's value as well as a comparison with similar homes in the area
Home Values in the Area
Average Home Value in this Area
Purchase History
| Date | Buyer | Sale Price | Title Company |
|---|---|---|---|
| Eppley David A | -- | None Available | |
| Hartig Debra J | $160,000 | Chicago Title Co | |
| Sherer Randall B | $165,000 | First American Title Co |
Source: Public Records
Mortgage History
| Date | Status | Borrower | Loan Amount |
|---|---|---|---|
| Open | Hartig Debra J | $155,200 | |
| Previous Owner | Sherer Randall B | $10,000 |
Source: Public Records
Tax History
| Year | Tax Paid | Tax Assessment Tax Assessment Total Assessment is a certain percentage of the fair market value that is determined by local assessors to be the total taxable value of land and additions on the property. | Land | Improvement |
|---|---|---|---|---|
| 2025 | $2,486 | $245,890 | $53,780 | $192,110 |
| 2024 | $2,427 | $241,070 | $52,726 | $188,344 |
| 2023 | $2,427 | $236,344 | $51,693 | $184,651 |
| 2022 | $2,363 | $231,711 | $50,680 | $181,031 |
| 2021 | $2,313 | $227,169 | $49,687 | $177,482 |
| 2020 | $1,576 | $154,575 | $49,178 | $105,397 |
| 2019 | $451 | $48,214 | $48,214 | $0 |
| 2018 | $2,230 | $216,112 | $47,269 | $168,843 |
| 2017 | $2,203 | $211,876 | $46,343 | $165,533 |
| 2016 | $2,077 | $207,723 | $45,435 | $162,288 |
| 2015 | $2,045 | $204,604 | $44,753 | $159,851 |
| 2014 | $2,019 | $200,597 | $43,877 | $156,720 |
Source: Public Records
Map
Nearby Homes
- 9705 Swasey Dr
- 15783 Gold Mine Ln
- 15685 Whispering Woods Trail
- 9770 Brickwood Dr
- 0 Mule Mountain Pkwy
- 15691 Old Stage Coach Rd
- 16177 Lower Springs Rd
- 10000 Tilton Mine Rd
- 10096 Victoria Dr
- 10141 Sandy Ln
- 10123 Victoria Dr
- 16275 Valparaiso Way
- 15809 Old Stage Coach Rd
- 10249 Carrousel Dr
- 10758 Muletown Rd
- 10255 Carrousel Dr
- 0 Rattlesnake Dr
- 15599 Sugar Cone Ln
- .63 acre Lot Swasey Dr
- 10266 White Star Dr
- 9714 Swasey Dr
- 15825 Clodhopper Dr
- 15806 Clodhopper Dr
- 15797 Scruffy Dr
- 9668 Swasey Dr
- 9681 Swasey Dr
- 15788 Scruffy Dr
- 9644 Swasey Dr
- 9731 Swasey Dr
- 9669 Swasey Dr
- 15821 Clodhopper Dr
- 2755 Swasey Dr
- 9640 Swasey Dr
- 15798 Scruffy Dr
- 9703 Swasey Dr
- 9657 Swasey Dr
- 15861 Joey Ln
- 15906 Lower Springs Rd
- 15882 Lower Springs Rd
- 15898 Lower Springs Rd --Hecm
Your Personal Tour Guide
Ask me questions while you tour the home.