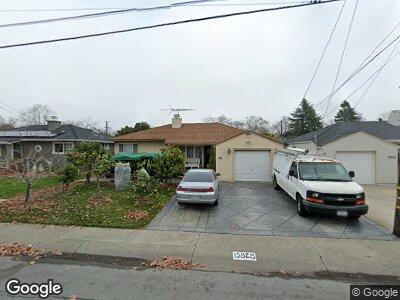
15828 Via Rivera San Lorenzo, CA 94580
Estimated Value: $663,000 - $960,000
3
Beds
2
Baths
1,818
Sq Ft
$476/Sq Ft
Est. Value
About This Home
This home is located at 15828 Via Rivera, San Lorenzo, CA 94580 and is currently estimated at $865,239, approximately $475 per square foot. 15828 Via Rivera is a home located in Alameda County with nearby schools including Grant Elementary School, Washington Manor Middle School, and San Lorenzo High School.
Ownership History
Date
Name
Owned For
Owner Type
Purchase Details
Closed on
Aug 4, 2014
Sold by
Tran Tiff Trucdao and Tran Christine Trucdao
Bought by
Truong Angela
Current Estimated Value
Purchase Details
Closed on
Jan 11, 2002
Sold by
Imperial Jose Luis L and Imperial Rosemarie
Bought by
Tran Truc Dao
Home Financials for this Owner
Home Financials are based on the most recent Mortgage that was taken out on this home.
Original Mortgage
$290,875
Interest Rate
6.84%
Mortgage Type
Stand Alone First
Purchase Details
Closed on
Jul 11, 2000
Sold by
Rogers Gerald D and Rogers Carmen M
Bought by
Imperial Jose Luis L and Imperial Rosemarie
Home Financials for this Owner
Home Financials are based on the most recent Mortgage that was taken out on this home.
Original Mortgage
$240,000
Interest Rate
9.25%
Create a Home Valuation Report for This Property
The Home Valuation Report is an in-depth analysis detailing your home's value as well as a comparison with similar homes in the area
Home Values in the Area
Average Home Value in this Area
Purchase History
| Date | Buyer | Sale Price | Title Company |
|---|---|---|---|
| Truong Angela | -- | None Available | |
| Tran Truc Dao | $332,500 | Fidelity National Title Co | |
| Imperial Jose Luis L | $300,000 | Chicago Title Co |
Source: Public Records
Mortgage History
| Date | Status | Borrower | Loan Amount |
|---|---|---|---|
| Previous Owner | Tran Truc Dao | $205,000 | |
| Previous Owner | Tran Truc Dao | $290,875 | |
| Previous Owner | Imperial Jose Luis L | $240,000 | |
| Closed | Imperial Jose Luis L | $45,000 |
Source: Public Records
Tax History Compared to Growth
Tax History
| Year | Tax Paid | Tax Assessment Tax Assessment Total Assessment is a certain percentage of the fair market value that is determined by local assessors to be the total taxable value of land and additions on the property. | Land | Improvement |
|---|---|---|---|---|
| 2024 | $7,580 | $571,450 | $171,435 | $400,015 |
| 2023 | $7,541 | $560,247 | $168,074 | $392,173 |
| 2022 | $7,433 | $549,261 | $164,778 | $384,483 |
| 2021 | $7,232 | $538,494 | $161,548 | $376,946 |
| 2020 | $7,079 | $532,975 | $159,892 | $373,083 |
| 2019 | $7,092 | $522,528 | $156,758 | $365,770 |
| 2018 | $6,712 | $512,285 | $153,685 | $358,600 |
| 2017 | $6,406 | $502,241 | $150,672 | $351,569 |
| 2016 | $6,113 | $492,395 | $147,718 | $344,677 |
| 2015 | $5,982 | $485,000 | $145,500 | $339,500 |
| 2014 | $5,046 | $400,688 | $120,266 | $280,422 |
Source: Public Records
Map
Nearby Homes
- 15822 Via Arroyo
- 278 Via Mirlo
- 96 Paseo Grande
- 15939 Saint Johns Dr
- 591 Via Acalanes
- 181 E Lewelling Blvd
- 183 E Lewelling Blvd
- 15540 Hesperian Blvd
- 179 Loma Verde Dr
- 15966 Via Conejo
- 16829 Daryl Ave
- 17303 Via Andeta
- 18289 Meekland Ave
- 15928 Mills Ave
- 0 E 14th St Unit 41059501
- 16370 Elgin Ct Unit 7
- 920 Elgin St Unit G
- 295 Hampton Rd
- 17039 Via Pasatiempo
- 886 Via Manzanas
- 15828 Via Rivera
- 15832 Via Rivera
- 15824 Via Rivera
- 15881 Via Granada
- 15889 Via Granada
- 15836 Via Rivera
- 15820 Via Rivera
- 15873 Via Granada
- 15909 Via Granada
- 15827 Via Rivera
- 15831 Via Rivera
- 15840 Via Rivera
- 15816 Via Rivera
- 15823 Via Rivera
- 15835 Via Rivera
- 15865 Via Granada
- 15917 Via Granada
- 15819 Via Rivera
- 15839 Via Rivera
- 15812 Via Rivera