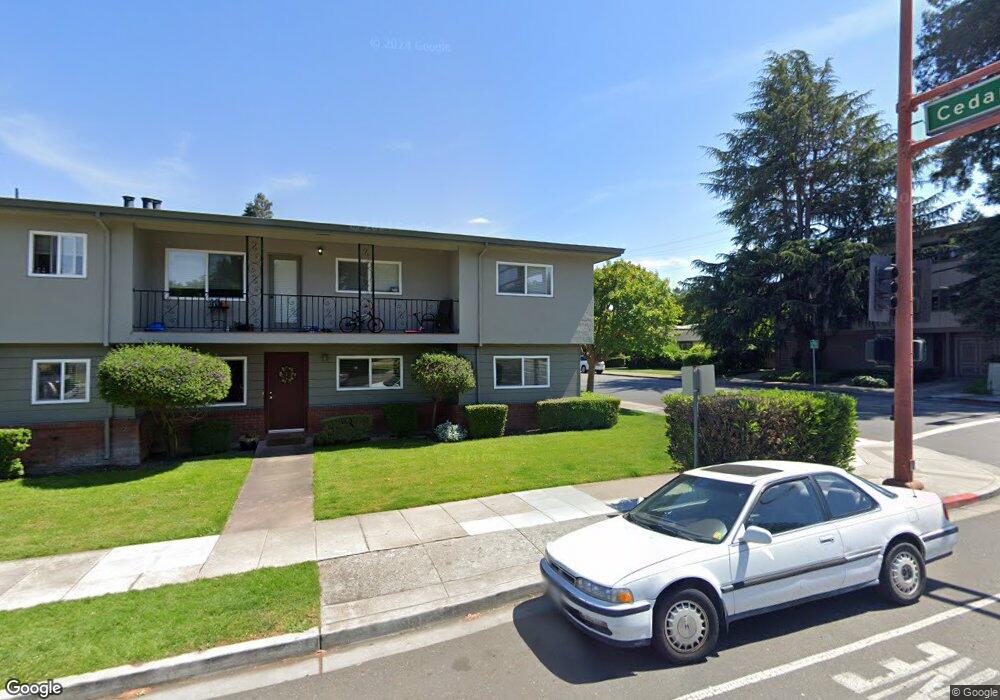
1583 Alameda San Carlos, CA 94070
El Sereno Corte NeighborhoodEstimated Value: $1,516,000 - $2,043,000
2
Beds
1
Bath
1,100
Sq Ft
$1,621/Sq Ft
Est. Value
About This Home
This home is located at 1583 Alameda, San Carlos, CA 94070 and is currently estimated at $1,782,958, approximately $1,620 per square foot. 1583 Alameda is a home located in San Mateo County with nearby schools including Brittan Acres Elementary School, Central Middle School, and Sequoia High School.
Ownership History
Date
Name
Owned For
Owner Type
Purchase Details
Closed on
Aug 25, 2015
Sold by
Chow Connie
Bought by
Chow Connie
Current Estimated Value
Purchase Details
Closed on
Jun 18, 2008
Sold by
Rooney James M
Bought by
Chow Connie
Home Financials for this Owner
Home Financials are based on the most recent Mortgage that was taken out on this home.
Original Mortgage
$414,000
Outstanding Balance
$263,207
Interest Rate
5.87%
Mortgage Type
Purchase Money Mortgage
Estimated Equity
$1,519,751
Purchase Details
Closed on
Jul 17, 1997
Sold by
Romig Glenn A and Romig Elisabeth R
Bought by
Rooney James M
Home Financials for this Owner
Home Financials are based on the most recent Mortgage that was taken out on this home.
Original Mortgage
$238,400
Interest Rate
4.95%
Create a Home Valuation Report for This Property
The Home Valuation Report is an in-depth analysis detailing your home's value as well as a comparison with similar homes in the area
Home Values in the Area
Average Home Value in this Area
Purchase History
| Date | Buyer | Sale Price | Title Company |
|---|---|---|---|
| Chow Connie | -- | None Available | |
| Chow Connie | $702,000 | Chicago Title Co | |
| Rooney James M | $298,000 | North American Title Insuran |
Source: Public Records
Mortgage History
| Date | Status | Borrower | Loan Amount |
|---|---|---|---|
| Open | Chow Connie | $414,000 | |
| Previous Owner | Rooney James M | $238,400 |
Source: Public Records
Tax History Compared to Growth
Tax History
| Year | Tax Paid | Tax Assessment Tax Assessment Total Assessment is a certain percentage of the fair market value that is determined by local assessors to be the total taxable value of land and additions on the property. | Land | Improvement |
|---|---|---|---|---|
| 2025 | $11,967 | $922,074 | $461,037 | $461,037 |
| 2023 | $11,967 | $886,272 | $443,136 | $443,136 |
| 2022 | $11,350 | $868,896 | $434,448 | $434,448 |
| 2021 | $11,183 | $851,860 | $425,930 | $425,930 |
| 2020 | $11,052 | $843,126 | $421,563 | $421,563 |
| 2019 | $10,835 | $826,596 | $413,298 | $413,298 |
| 2018 | $10,549 | $810,390 | $405,195 | $405,195 |
| 2017 | $10,404 | $794,500 | $397,250 | $397,250 |
| 2016 | $10,180 | $778,922 | $389,461 | $389,461 |
| 2015 | $10,146 | $767,222 | $383,611 | $383,611 |
| 2014 | $9,830 | $752,194 | $376,097 | $376,097 |
Source: Public Records
Map
Nearby Homes