Estimated Value: $429,000 - $463,518
4
Beds
3
Baths
2,650
Sq Ft
$167/Sq Ft
Est. Value
About This Home
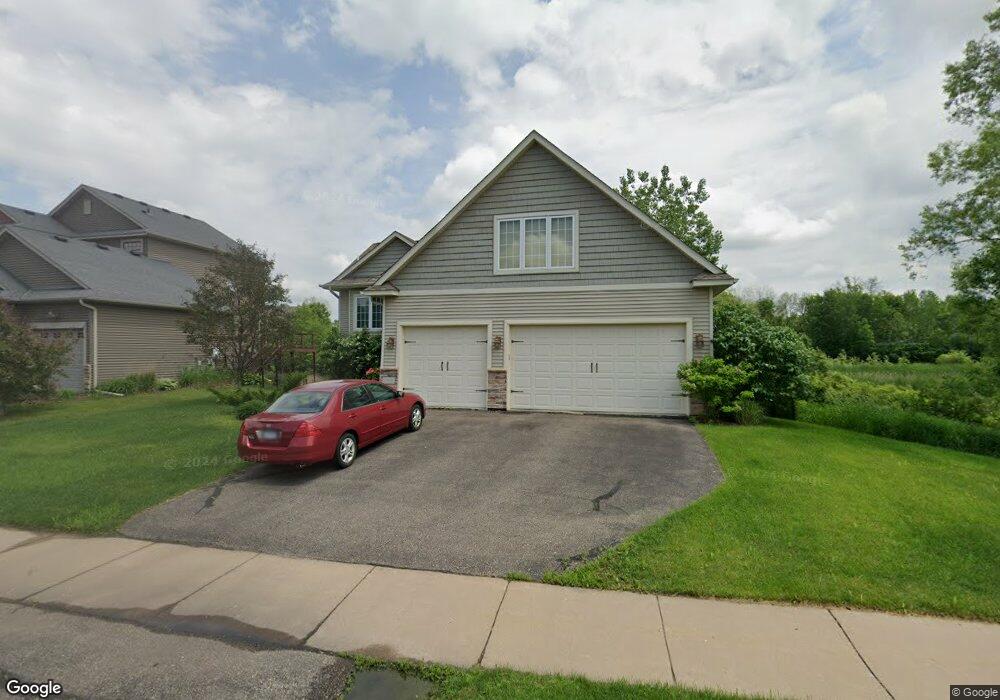
This home is located at 15830 Farnham Ave N, Hugo, MN 55038 and is currently estimated at $443,380, approximately $167 per square foot. 15830 Farnham Ave N is a home located in Washington County with nearby schools including Oneka Elementary School, Hugo Elementary School, and Central Middle School.
Ownership History
Date
Name
Owned For
Owner Type
Purchase Details
Closed on
Dec 18, 2020
Sold by
Altstatt Nicole Anne and Altstatt Alex Richard
Bought by
Dahl Jeremy B and Dahl Tonya L
Current Estimated Value
Home Financials for this Owner
Home Financials are based on the most recent Mortgage that was taken out on this home.
Original Mortgage
$353,892
Interest Rate
2.7%
Mortgage Type
New Conventional
Purchase Details
Closed on
Nov 23, 2015
Sold by
Altstatt Nicole Anne and Altstatt Alex Richard
Bought by
Altstatt Nicole Anne and Altstatt Alex Richard
Home Financials for this Owner
Home Financials are based on the most recent Mortgage that was taken out on this home.
Original Mortgage
$196,519
Interest Rate
3.78%
Mortgage Type
New Conventional
Purchase Details
Closed on
Jan 21, 2005
Sold by
Waters Edge North Sf Llc
Bought by
Custom Homes Inc
Create a Home Valuation Report for This Property
The Home Valuation Report is an in-depth analysis detailing your home's value as well as a comparison with similar homes in the area
Home Values in the Area
Average Home Value in this Area
Purchase History
| Date | Buyer | Sale Price | Title Company |
|---|---|---|---|
| Dahl Jeremy B | $389,900 | Title Specialists Inc | |
| Altstatt Nicole Anne | -- | Cambria Title | |
| Custom Homes Inc | $205,050 | -- | |
| Dahl Jeremy Jeremy | $389,900 | -- |
Source: Public Records
Mortgage History
| Date | Status | Borrower | Loan Amount |
|---|---|---|---|
| Previous Owner | Dahl Jeremy B | $353,892 | |
| Previous Owner | Altstatt Nicole Anne | $196,519 | |
| Closed | Dahl Jeremy Jeremy | $353,892 |
Source: Public Records
Tax History Compared to Growth
Tax History
| Year | Tax Paid | Tax Assessment Tax Assessment Total Assessment is a certain percentage of the fair market value that is determined by local assessors to be the total taxable value of land and additions on the property. | Land | Improvement |
|---|---|---|---|---|
| 2024 | $4,674 | $400,400 | $91,500 | $308,900 |
| 2023 | $4,674 | $453,200 | $126,500 | $326,700 |
| 2022 | $4,392 | $436,700 | $132,200 | $304,500 |
| 2021 | $4,318 | $349,600 | $105,000 | $244,600 |
| 2020 | $4,384 | $346,100 | $110,000 | $236,100 |
| 2019 | $3,726 | $337,300 | $100,000 | $237,300 |
| 2018 | $3,470 | $316,700 | $100,000 | $216,700 |
| 2017 | $3,164 | $303,300 | $95,000 | $208,300 |
| 2016 | $3,062 | $276,100 | $77,000 | $199,100 |
| 2015 | $2,732 | $219,500 | $62,400 | $157,100 |
| 2013 | -- | $190,500 | $48,700 | $141,800 |
Source: Public Records
Map
Nearby Homes
- 5082 157th St N
- 15911 Finale Ct N
- 15921 Finale Ct N
- 16109 Fairoaks Ave N
- 4798 Prairie Trail N
- 4845 Empress Ave N
- 4907 Evergreen Dr N
- 4905 Evergreen Dr N
- The Mulberry Plan at Oneka Prairie
- The Waverly Plan at Oneka Prairie
- The Primrose Plan at Oneka Prairie
- The Newport Plan at Oneka Prairie
- The Brook View Plan at Oneka Prairie
- The Ashton Plan at Oneka Prairie
- The Cheyenne Plan at Oneka Prairie
- The Water Stone Plan at Oneka Prairie
- 4911 162nd St N
- 4906 162nd St N
- 4901 Education Dr N
- 15895 Ethan Trail N
- 15840 Farnham Ave N
- 15771 Farnham Ave N
- 5265 Fenson Ct N
- 15860 Farnham Ave N
- 15763 Farnham Ave N
- 5190 158th St N
- 5269 Fenson Ct N
- 5259 Fenson Ct N
- 5170 158th St N
- 15749 Farnham Ave N
- 5164 158th St N
- 5257 Fenson Ct N
- 15880 Farnham Ave N
- 5150 158th St N
- 15739 Farnham Ave N
- 6141 158th St N
- 5197 158th St N
- 5273 Fenson Ct N
- 5255 Fenson Ct N
- 5140 158th St N