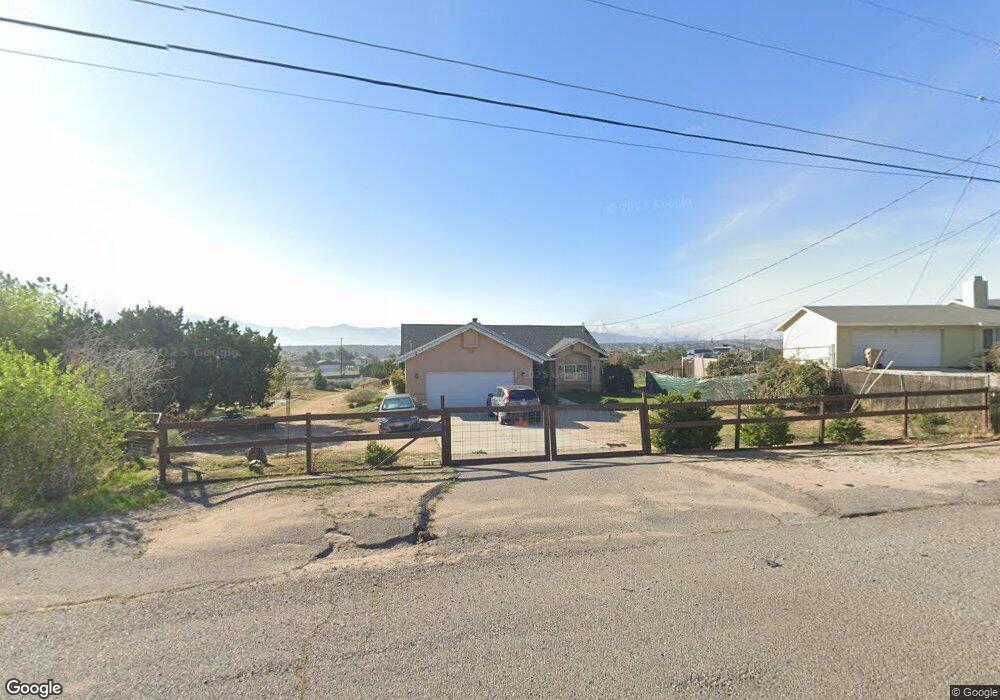
15839 Dalscote St Hesperia, CA 92345
The Mesa NeighborhoodEstimated Value: $446,000 - $464,981
3
Beds
2
Baths
1,660
Sq Ft
$276/Sq Ft
Est. Value
About This Home
This home is located at 15839 Dalscote St, Hesperia, CA 92345 and is currently estimated at $457,745, approximately $275 per square foot. 15839 Dalscote St is a home located in San Bernardino County with nearby schools including Mesa Grande Elementary School, Cedar Middle School, and Oak Hills High School.
Ownership History
Date
Name
Owned For
Owner Type
Purchase Details
Closed on
Jul 2, 2013
Sold by
Rodriguez Peter A
Bought by
Rodriguez Peter A and Rodriguez Jennie L
Current Estimated Value
Purchase Details
Closed on
Sep 23, 2010
Sold by
Rodriguez Jennie L
Bought by
Rodriguez Pete A
Purchase Details
Closed on
Aug 19, 2008
Sold by
Accredited Home Lenders Inc
Bought by
Rodriguez Pete A
Home Financials for this Owner
Home Financials are based on the most recent Mortgage that was taken out on this home.
Original Mortgage
$138,479
Outstanding Balance
$91,643
Interest Rate
6.5%
Mortgage Type
FHA
Estimated Equity
$366,102
Purchase Details
Closed on
Jan 31, 2008
Sold by
Farias Luis A
Bought by
Accredited Home Lenders Inc
Purchase Details
Closed on
Jan 5, 2005
Sold by
Rose Randy
Bought by
Farias Luis A
Home Financials for this Owner
Home Financials are based on the most recent Mortgage that was taken out on this home.
Original Mortgage
$200,000
Interest Rate
6.75%
Mortgage Type
Purchase Money Mortgage
Purchase Details
Closed on
Aug 29, 2003
Sold by
Miller Vivian J
Bought by
Rose Randy and Rose Leesa
Purchase Details
Closed on
Jul 18, 2002
Sold by
Godson Alexander D
Bought by
Miller Vivian J
Create a Home Valuation Report for This Property
The Home Valuation Report is an in-depth analysis detailing your home's value as well as a comparison with similar homes in the area
Home Values in the Area
Average Home Value in this Area
Purchase History
| Date | Buyer | Sale Price | Title Company |
|---|---|---|---|
| Rodriguez Peter A | -- | None Available | |
| Rodriguez Pete A | -- | Fidelity National Title | |
| Rodriguez Pete A | $141,000 | Chicago Title Company | |
| Accredited Home Lenders Inc | $195,219 | Fnt | |
| Farias Luis A | $250,000 | Commonwealth Title | |
| Rose Randy | $12,000 | Chicago Title Co | |
| Miller Vivian J | $6,500 | -- |
Source: Public Records
Mortgage History
| Date | Status | Borrower | Loan Amount |
|---|---|---|---|
| Open | Rodriguez Pete A | $138,479 | |
| Previous Owner | Farias Luis A | $200,000 | |
| Closed | Farias Luis A | $50,000 |
Source: Public Records
Tax History Compared to Growth
Tax History
| Year | Tax Paid | Tax Assessment Tax Assessment Total Assessment is a certain percentage of the fair market value that is determined by local assessors to be the total taxable value of land and additions on the property. | Land | Improvement |
|---|---|---|---|---|
| 2025 | $2,383 | $216,733 | $39,407 | $177,326 |
| 2024 | $2,383 | $212,483 | $38,634 | $173,849 |
| 2023 | $2,357 | $208,316 | $37,876 | $170,440 |
| 2022 | $2,303 | $204,231 | $37,133 | $167,098 |
| 2021 | $2,261 | $200,227 | $36,405 | $163,822 |
| 2020 | $2,235 | $198,174 | $36,032 | $162,142 |
| 2019 | $2,189 | $194,288 | $35,325 | $158,963 |
| 2018 | $2,147 | $190,478 | $34,632 | $155,846 |
| 2017 | $2,110 | $186,743 | $33,953 | $152,790 |
| 2016 | $2,065 | $183,081 | $33,287 | $149,794 |
| 2015 | $2,039 | $180,331 | $32,787 | $147,544 |
| 2014 | $1,655 | $145,000 | $20,000 | $125,000 |
Source: Public Records
Map
Nearby Homes
- 15815 Arbury St
- 6995 Summit Valley Rd
- 0 Lurelane Ave
- 15790 Jenny St
- 0 Juniper Unit 25590291
- 0 Juniper St Unit IV25199725
- 0 Juniper St Unit CV25173548
- 0 Ortega St Unit OC25117108
- 0 Juniper St Unit HD25105019
- 0 Juniper Unit HD25037279
- 0 Juniper St Unit IV25032447
- 0 Juniper St Unit HD25029822
- 0 Carrissa Ave Unit HD24049636
- 0 Outer Bear Valley Rd Unit HD22221154
- 0 H St Unit HD22159747
- 15345 Farmington St
- 0 Middleton Ave
- 16230 Rodeo St
- 15291 Wells Fargo St
- 5071 McConneny Rd
- 15827 Dalscote St
- 7071 Dalscote St
- 7083 Dalscote St
- 15811 Dalscote St
- 15840 Dalscote St
- 15812 Dalscote St
- 7095 Dalscote St
- 15795 Dalscote St
- 15853 Cromdale St
- 6989 Eton Ct
- 15798 Dalscote St
- 15831 Cromdale St
- 6995 Eton Ct
- 15815 Cromdale St
- 15779 Dalscote St
- 7109 Dalscote St
- 15782 Dalscote St
- 7022 Santa fe Ave E
- 7124 Dalscote St
- 15766 Dalscote St