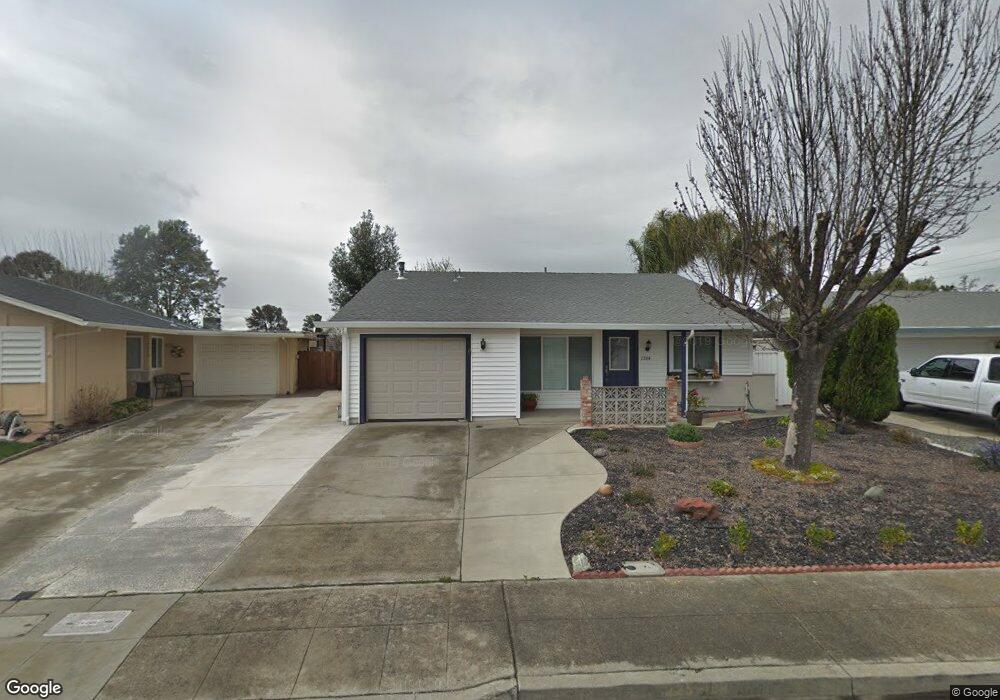
1584 Marigold Rd Livermore, CA 94551
Springtown NeighborhoodEstimated Value: $891,000 - $1,020,000
4
Beds
2
Baths
1,778
Sq Ft
$545/Sq Ft
Est. Value
About This Home
This home is located at 1584 Marigold Rd, Livermore, CA 94551 and is currently estimated at $969,452, approximately $545 per square foot. 1584 Marigold Rd is a home located in Alameda County with nearby schools including Altamont Creek Elementary School, Andrew N. Christensen Middle School, and Livermore High School.
Ownership History
Date
Name
Owned For
Owner Type
Purchase Details
Closed on
Oct 2, 2012
Sold by
Dilger Catherine A and Catherine Anne Dilger Trust
Bought by
Nguyen Thinh D and Tran Hoa T
Current Estimated Value
Home Financials for this Owner
Home Financials are based on the most recent Mortgage that was taken out on this home.
Original Mortgage
$216,000
Outstanding Balance
$150,416
Interest Rate
3.63%
Mortgage Type
New Conventional
Estimated Equity
$819,036
Purchase Details
Closed on
Oct 25, 2010
Sold by
Dilger Catherine A
Bought by
Dilger Catherine A and Catherine Anne Dilger Trust
Purchase Details
Closed on
Dec 17, 2003
Sold by
Dilger Catherine A
Bought by
Dilger Catherine A and The Catherine Anne Dilger Trus
Purchase Details
Closed on
Dec 15, 1998
Sold by
Dilger Catherine and Dilger Catherine A
Bought by
Dilger Catherine A
Home Financials for this Owner
Home Financials are based on the most recent Mortgage that was taken out on this home.
Original Mortgage
$89,000
Interest Rate
6.91%
Create a Home Valuation Report for This Property
The Home Valuation Report is an in-depth analysis detailing your home's value as well as a comparison with similar homes in the area
Home Values in the Area
Average Home Value in this Area
Purchase History
| Date | Buyer | Sale Price | Title Company |
|---|---|---|---|
| Nguyen Thinh D | $270,000 | Old Republic Title Company | |
| Dilger Catherine A | -- | None Available | |
| Dilger Catherine A | -- | -- | |
| Dilger Catherine A | -- | First American Title Guarant |
Source: Public Records
Mortgage History
| Date | Status | Borrower | Loan Amount |
|---|---|---|---|
| Open | Nguyen Thinh D | $216,000 | |
| Previous Owner | Dilger Catherine A | $89,000 |
Source: Public Records
Tax History
| Year | Tax Paid | Tax Assessment Tax Assessment Total Assessment is a certain percentage of the fair market value that is determined by local assessors to be the total taxable value of land and additions on the property. | Land | Improvement |
|---|---|---|---|---|
| 2025 | $6,375 | $469,789 | $99,741 | $370,048 |
| 2024 | $6,375 | $460,579 | $97,786 | $362,793 |
| 2023 | $6,272 | $451,549 | $95,869 | $355,680 |
| 2022 | $6,174 | $442,696 | $93,989 | $348,707 |
| 2021 | $6,044 | $434,018 | $92,147 | $341,871 |
| 2020 | $5,862 | $429,569 | $91,202 | $338,367 |
| 2019 | $5,880 | $421,149 | $89,415 | $331,734 |
| 2018 | $5,748 | $412,893 | $87,662 | $325,231 |
| 2017 | $5,596 | $404,797 | $85,943 | $318,854 |
| 2016 | $5,382 | $396,861 | $84,258 | $312,603 |
| 2015 | $3,801 | $276,644 | $82,993 | $193,651 |
| 2014 | $3,732 | $271,225 | $81,367 | $189,858 |
Source: Public Records
Map
Nearby Homes
- 1817 Bluebell Dr
- 1279 Marigold Rd
- 4669 Golf Dr
- 1264 Tulip Way
- 1686 Rhododendron Dr
- 4363 Golf Dr
- 1414 Columbine Way
- 1498 Columbine Way
- 2013 Galloway Common
- 1913 Monterey Dr
- 1905 Monterey Dr
- 1128 Larkspur Dr
- 884 Sungold Cir Unit 123
- 1031 Spring Valley Common
- 4138 Bishop Pine Way
- 5473 Rainflower Dr
- 2060 Broadmoor St
- 1602 Autumn Oak Dr
- 5741 Rainflower Dr
- 1426 Jayhawk Ln
- 1576 Marigold Rd
- 1592 Marigold Rd
- 1610 Bluebell Dr
- 5245 Peony Dr
- 1568 Marigold Rd
- 1583 Marigold Rd
- 0 Bluebell Dr Unit 41080380
- 0 Bluebell Dr
- 1632 Bluebell Dr
- 1575 Marigold Rd
- 1591 Marigold Rd
- 1560 Marigold Rd
- 5233 Peony Dr
- 5269 Peony Dr
- 1567 Marigold Rd
- 1658 Bluebell Dr
- 5219 Peony Dr
- 1587 Bluebell Ct
- 1552 Marigold Rd
- 1559 Marigold Ct
Your Personal Tour Guide
Ask me questions while you tour the home.