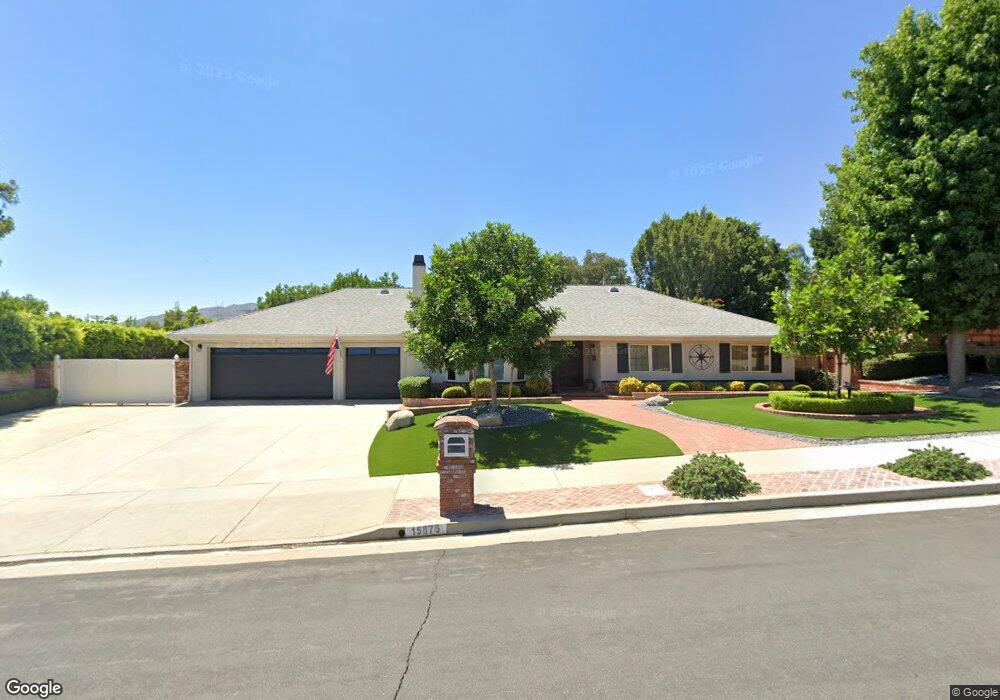
15875 Mc Queen St Sylmar, CA 91342
Estimated Value: $867,000 - $1,249,000
3
Beds
2
Baths
1,855
Sq Ft
$570/Sq Ft
Est. Value
About This Home
This home is located at 15875 Mc Queen St, Sylmar, CA 91342 and is currently estimated at $1,056,739, approximately $569 per square foot. 15875 Mc Queen St is a home located in Los Angeles County with nearby schools including Herrick Avenue Elementary School, Olive Vista Middle School, and San Fernando Senior High School.
Ownership History
Date
Name
Owned For
Owner Type
Purchase Details
Closed on
Mar 31, 2020
Sold by
Robert Richard and Robert Anita
Bought by
Robert Richard H and Robert Anita J
Current Estimated Value
Home Financials for this Owner
Home Financials are based on the most recent Mortgage that was taken out on this home.
Original Mortgage
$368,725
Outstanding Balance
$326,646
Interest Rate
3.4%
Mortgage Type
VA
Estimated Equity
$730,093
Purchase Details
Closed on
Jul 10, 2014
Sold by
Robert Richard H
Bought by
Robert 2014 Revocabl Richard H and Robert 2014 Revocabl Anita J
Purchase Details
Closed on
May 5, 1998
Sold by
Cross William M
Bought by
Robert Richard M and Robert Anita J
Home Financials for this Owner
Home Financials are based on the most recent Mortgage that was taken out on this home.
Original Mortgage
$227,150
Interest Rate
7.17%
Create a Home Valuation Report for This Property
The Home Valuation Report is an in-depth analysis detailing your home's value as well as a comparison with similar homes in the area
Home Values in the Area
Average Home Value in this Area
Purchase History
| Date | Buyer | Sale Price | Title Company |
|---|---|---|---|
| Robert Richard H | -- | Western Resources Title Co | |
| Robert Richard | -- | Western Resources Title Co | |
| Robert 2014 Revocabl Richard H | -- | None Available | |
| Robert Richard M | $290,000 | Old Republic Title |
Source: Public Records
Mortgage History
| Date | Status | Borrower | Loan Amount |
|---|---|---|---|
| Open | Robert Richard | $368,725 | |
| Closed | Robert Richard M | $227,150 |
Source: Public Records
Tax History Compared to Growth
Tax History
| Year | Tax Paid | Tax Assessment Tax Assessment Total Assessment is a certain percentage of the fair market value that is determined by local assessors to be the total taxable value of land and additions on the property. | Land | Improvement |
|---|---|---|---|---|
| 2025 | $5,980 | $463,038 | $191,600 | $271,438 |
| 2024 | $5,980 | $453,960 | $187,844 | $266,116 |
| 2023 | $5,872 | $445,060 | $184,161 | $260,899 |
| 2022 | $5,616 | $436,334 | $180,550 | $255,784 |
| 2021 | $5,543 | $427,779 | $177,010 | $250,769 |
| 2019 | $5,386 | $415,092 | $171,760 | $243,332 |
| 2018 | $5,183 | $406,954 | $168,393 | $238,561 |
| 2016 | $4,946 | $391,154 | $161,855 | $229,299 |
| 2015 | $4,877 | $385,279 | $159,424 | $225,855 |
| 2014 | $4,903 | $377,733 | $156,302 | $221,431 |
Source: Public Records
Map
Nearby Homes
- 16079 Yarnell St Unit B18
- 15574 Sorbonne St
- 15873 Yarnell St
- 16121 Filbert St
- 15831 Olden St Unit 63
- 13775 Glenoaks Blvd Unit 16
- 13800 Glenoaks Blvd
- 13575 De Garmo Ave
- 13346 Los Olivos Rd
- 16414 W Nicklaus Dr Unit 146
- 16410 W Nicklaus Dr Unit 143
- 15232 Foothill Blvd Unit 111
- 15455 Glenoaks Blvd Unit 46
- 15455 Glenoaks Blvd Unit 507
- 15455 Glenoaks Blvd Unit 94
- 15455 Glenoaks Blvd Unit 226
- 15455 Glenoaks Blvd Unit 502
- 15455 Glenoaks Blvd Unit 146
- 15455 Glenoaks Blvd Unit 557
- 15455 Glenoaks Blvd Unit 299
- 15885 Mc Queen St
- 15865 Mc Queen St
- 16024 Yarnell St
- 16014 Yarnell St
- 15878 Mc Queen St
- 16034 Yarnell St
- 16004 Yarnell St
- 15888 Mc Queen St
- 15866 Mc Queen St
- 15901 Mc Queen St
- 13840 Woodcock Ave
- 16044 Yarnell St
- 15841 Swain St
- 13845 Herrick Ave
- 15931 Foothill Blvd
- 15935 Foothill Blvd
- 15909 Mc Queen St
- 15965 Yarnell St
- 16054 Yarnell St
- 15851 Swain St