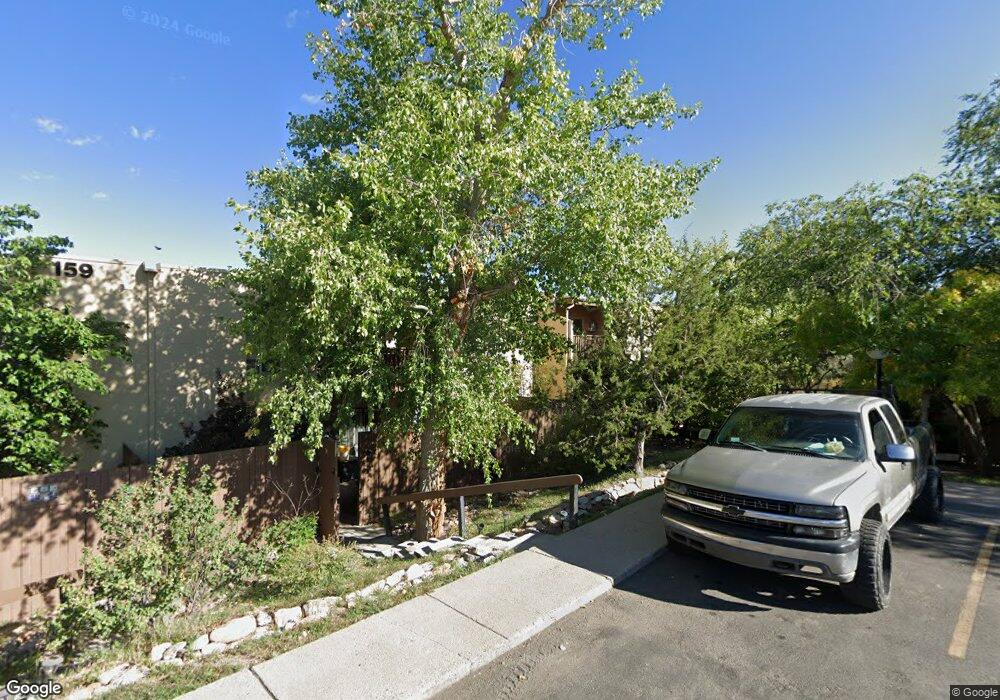
159 Calle Ojo Feliz Unit T Santa Fe, NM 87505
Arroyo Chamiso NeighborhoodEstimated Value: $257,000 - $273,000
2
Beds
1
Bath
830
Sq Ft
$321/Sq Ft
Est. Value
About This Home
This home is located at 159 Calle Ojo Feliz Unit T, Santa Fe, NM 87505 and is currently estimated at $266,327, approximately $320 per square foot. 159 Calle Ojo Feliz Unit T is a home located in Santa Fe County with nearby schools including E.J. Martinez Elementary School, Santa Fe High School, and Little Earth School.
Ownership History
Date
Name
Owned For
Owner Type
Purchase Details
Closed on
Nov 22, 2019
Sold by
Rice Dale Alan
Bought by
Leschinsky Lisa
Current Estimated Value
Home Financials for this Owner
Home Financials are based on the most recent Mortgage that was taken out on this home.
Original Mortgage
$120,000
Outstanding Balance
$105,358
Interest Rate
3.5%
Mortgage Type
New Conventional
Estimated Equity
$160,969
Purchase Details
Closed on
Aug 12, 2013
Sold by
Fannie Mae
Bought by
Rice Dale Alan
Purchase Details
Closed on
Nov 8, 2012
Sold by
Halvorsen Steven
Bought by
Wells Fargo Bank Na
Purchase Details
Closed on
Feb 28, 2007
Sold by
Pollock Lewis G
Bought by
Halvorsen Steven
Home Financials for this Owner
Home Financials are based on the most recent Mortgage that was taken out on this home.
Original Mortgage
$130,500
Interest Rate
6.21%
Mortgage Type
Purchase Money Mortgage
Create a Home Valuation Report for This Property
The Home Valuation Report is an in-depth analysis detailing your home's value as well as a comparison with similar homes in the area
Home Values in the Area
Average Home Value in this Area
Purchase History
| Date | Buyer | Sale Price | Title Company |
|---|---|---|---|
| Leschinsky Lisa | -- | None Available | |
| Rice Dale Alan | -- | American Southwest Title | |
| Wells Fargo Bank Na | -- | None Available | |
| Halvorsen Steven | -- | Southwestern Title & Escrow |
Source: Public Records
Mortgage History
| Date | Status | Borrower | Loan Amount |
|---|---|---|---|
| Open | Leschinsky Lisa | $120,000 | |
| Previous Owner | Halvorsen Steven | $130,500 |
Source: Public Records
Tax History Compared to Growth
Tax History
| Year | Tax Paid | Tax Assessment Tax Assessment Total Assessment is a certain percentage of the fair market value that is determined by local assessors to be the total taxable value of land and additions on the property. | Land | Improvement |
|---|---|---|---|---|
| 2024 | $1,166 | $153,008 | -- | $153,008 |
| 2023 | $1,166 | $148,552 | $0 | $148,552 |
| 2022 | $1,140 | $144,226 | $0 | $144,226 |
| 2021 | $1,123 | $46,675 | $0 | $46,675 |
| 2020 | $1,108 | $46,099 | $0 | $46,099 |
| 2019 | $757 | $31,015 | $0 | $31,015 |
| 2018 | $740 | $30,112 | $0 | $30,112 |
| 2017 | $722 | $29,235 | $0 | $29,235 |
| 2016 | $680 | $28,383 | $0 | $28,383 |
| 2015 | $665 | $27,557 | $0 | $27,557 |
| 2014 | $838 | $35,844 | $0 | $35,844 |
Source: Public Records
Map
Nearby Homes
- 157 Calle Ojo Feliz Unit D
- 151 Calle Ojo Feliz Unit T
- 149 Calle Ojo Feliz Unit B
- 150 Calle Ojo Feliz
- 147 Calle Ojo Feliz Unit U
- 2175 Old Arroyo Chamiso Unit 1,,2,3,4,5,6
- 125 Chamiso Ln
- 2305 Brother Abdon Way
- 2306 Brother Luke Place
- 2328 Calle Camarico
- 1566 Camino Amado
- 2210 Miguel Chavez Rd Unit 924
- 2210 Miguel Chavez Rd Unit 112
- 2210 Miguel Chavez Rd Unit 1616
- 2210 Miguel Chavez Rd Unit 812
- 2210 Miguel Chavez Rd Unit 723
- 2210 Miguel Chavez Rd Unit 1814
- 2210 Miguel Chavez Rd Unit 511
- 2210 Miguel Chavez Rd Unit 1816
- 2210 Miguel Chavez Rd Unit 1212
- 159 Calle Ojo Feliz Unit Q
- 159 Calle Ojo Feliz
- 159 Calle Ojo Feliz Unit D
- 159 Calle Ojo Feliz Unit X
- 159 Calle Ojo Feliz
- 159 Calle Ojo Feliz
- 159 Calle Ojo Feliz
- 159 Calle Ojo Feliz
- 159 Calle Ojo Feliz Unit R
- 159 Calle Ojo Feliz Unit O
- 159 Calle Ojo Feliz Unit F
- 157 Calle Ojo Feliz "B" Unit B
- 161 Calle Ojo Feliz Unit J
- 161 Calle Ojo Feliz Unit D
- 161 Calle Ojo Feliz
- 161 Calle Ojo Feliz Unit H
- 161 Calle Ojo Feliz Unit F
- 161 Calle Ojo Feliz
- 161 Calle Ojo Feliz Unit I
- 161 Calle Ojo Feliz Unit M