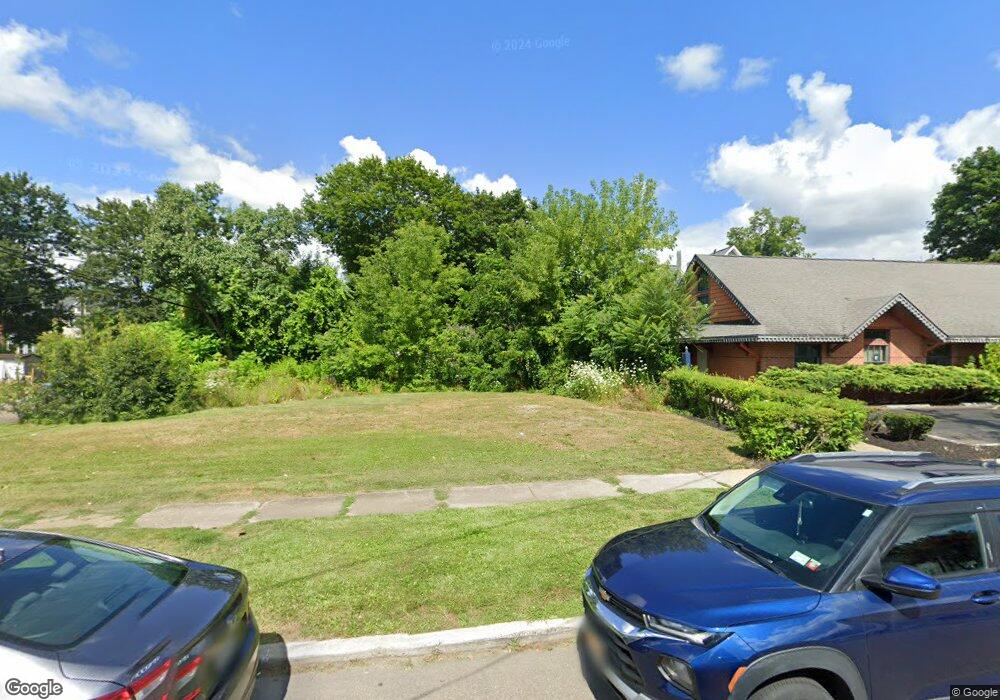
159 Columbia St Corning, NY 14830
Estimated Value: $70,000 - $135,000
3
Beds
2
Baths
1,220
Sq Ft
$93/Sq Ft
Est. Value
About This Home
This home is located at 159 Columbia St, Corning, NY 14830 and is currently estimated at $113,000, approximately $92 per square foot. 159 Columbia St is a home located in Steuben County with nearby schools including William E. Severn Elementary School, Corning-Painted Post Middle School, and Corning-Painted Post High School.
Ownership History
Date
Name
Owned For
Owner Type
Purchase Details
Closed on
Dec 4, 2019
Sold by
Stueben County Land Bank
Bought by
Stueben Cnty Habitat Hmnt
Current Estimated Value
Purchase Details
Closed on
May 23, 2019
Sold by
Steuben County Habitat
Bought by
Steuben County Land Bank
Purchase Details
Closed on
Dec 22, 2017
Sold by
Michael A & M K Gonta Ret and Gonta Tr
Bought by
Steuben Church People
Purchase Details
Closed on
Aug 26, 2016
Sold by
The Michael A & Mary K Gonta Revocable L
Bought by
Kosty Alexander
Purchase Details
Closed on
Apr 4, 2007
Sold by
Gonta Michael
Bought by
Gonta Michael A Living Trust
Purchase Details
Closed on
Jan 23, 1998
Create a Home Valuation Report for This Property
The Home Valuation Report is an in-depth analysis detailing your home's value as well as a comparison with similar homes in the area
Home Values in the Area
Average Home Value in this Area
Purchase History
| Date | Buyer | Sale Price | Title Company |
|---|---|---|---|
| Stueben Cnty Habitat Hmnt | $6,967 | None Available | |
| Steuben County Land Bank | -- | -- | |
| Steuben Church People | -- | -- | |
| Kosty Alexander | -- | N/A | |
| Gonta Michael A Living Trust | -- | -- | |
| -- | -- | -- |
Source: Public Records
Tax History
| Year | Tax Paid | Tax Assessment Tax Assessment Total Assessment is a certain percentage of the fair market value that is determined by local assessors to be the total taxable value of land and additions on the property. | Land | Improvement |
|---|---|---|---|---|
| 2024 | -- | $10,500 | $10,500 | $0 |
| 2023 | -- | $10,500 | $10,500 | $0 |
| 2022 | -- | $46,000 | $10,400 | $35,600 |
| 2021 | $1,744 | $46,000 | $10,400 | $35,600 |
| 2020 | $1,744 | $46,000 | $10,400 | $35,600 |
| 2019 | $1,784 | $46,000 | $10,400 | $35,600 |
| 2018 | $1,784 | $40,000 | $5,800 | $34,200 |
| 2017 | $1,321 | $40,000 | $5,800 | $34,200 |
| 2016 | $1,306 | $40,000 | $5,800 | $34,200 |
| 2015 | -- | $40,000 | $5,800 | $34,200 |
| 2014 | -- | $40,000 | $5,800 | $34,200 |
Source: Public Records
Map
Nearby Homes
- 290 Diatreta Ln
- 217 E 3rd St
- 190 E 3rd St
- 332 E 2nd St
- 264 E 4th St
- 268-270 E 4th St
- 329 E Market Street Extension
- 326 Woodview Ave
- 335 E Market Street Extension
- 360 E 1st St
- 327 Woodview Ave
- 169 Wall St
- 183-185 Wall St
- 87 E 2nd St
- 199 Wall St
- 159 Watauga Ave
- 156 Watauga Ave
- 422 Watauga Ave
- 422 Watauga Avenue Extension
- 53 Mcmahon Ave
Your Personal Tour Guide
Ask me questions while you tour the home.