
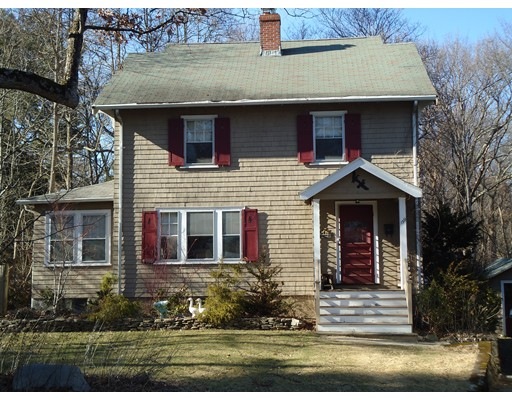
159 Marked Tree Rd Needham, MA 02492
4
Beds
2
Baths
1,924
Sq Ft
0.88
Acres
About This Home
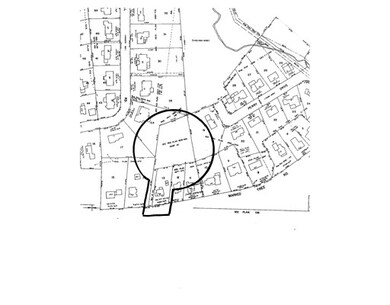
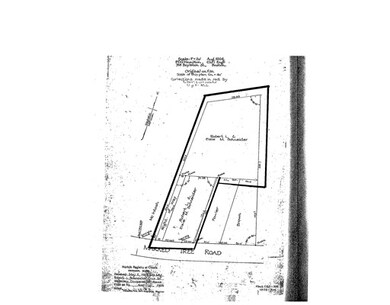
As of February 2018Build your dream home on this 38,000+ sq ft lot less than 3/4 mile to Needham shops and train. Please note that the property is being marketed for land value only. The house sits on a 9,950 sq ft lot. There is an additional abutting vacant lot consisting of 28,387 sq ft. According to public record, the total square footage is 38,337 sq ft. No additional information is available regarding the use or whether or not the lot can be subdivided. The buyer must do their own due diligence.
Home Details
Home Type
Single Family
Est. Annual Taxes
$30,861
Year Built
1924
Lot Details
0
Listing Details
- Lot Description: Wooded
- Property Type: Single Family
- Other Agent: 2.50
- Lead Paint: Unknown
- Year Round: Yes
- Special Features: None
- Property Sub Type: Detached
- Year Built: 1924
Interior Features
- Fireplaces: 1
- Has Basement: Yes
- Fireplaces: 1
- Number of Rooms: 9
- Amenities: Public Transportation, Medical Facility
- Basement: Full
Exterior Features
- Roof: Asphalt/Fiberglass Shingles
- Construction: Frame
- Exterior: Wood
- Foundation: Other (See Remarks)
Garage/Parking
- Garage Parking: Detached
- Garage Spaces: 1
- Parking: Off-Street
- Parking Spaces: 3
Utilities
- Heating: Hot Water Baseboard, Oil
- Sewer: Other (See Remarks)
- Water: Other (See Remarks)
Schools
- Elementary School: Newman
- Middle School: H.R./Pollard
- High School: Needham
Lot Info
- Assessor Parcel Number: M:1410001300000
- Zoning: SRB
Similar Homes in the area
Create a Home Valuation Report for This Property
The Home Valuation Report is an in-depth analysis detailing your home's value as well as a comparison with similar homes in the area
Home Values in the Area
Average Home Value in this Area
Mortgage History
| Date | Status | Loan Amount | Loan Type |
|---|---|---|---|
| Closed | $125,000 | Stand Alone Refi Refinance Of Original Loan | |
| Closed | $1,400,000 | Purchase Money Mortgage | |
| Closed | $1,050,000 | Commercial | |
| Closed | $795,000 | Reverse Mortgage Home Equity Conversion Mortgage |
Source: Public Records
Property History
| Date | Event | Price | Change | Sq Ft Price |
|---|---|---|---|---|
| 06/18/2025 06/18/25 | Price Changed | $2,700,000 | -1.8% | $389 / Sq Ft |
| 05/27/2025 05/27/25 | For Sale | $2,750,000 | +57.1% | $396 / Sq Ft |
| 02/05/2018 02/05/18 | Sold | $1,750,000 | -2.7% | $330 / Sq Ft |
| 12/13/2017 12/13/17 | Pending | -- | -- | -- |
| 07/24/2017 07/24/17 | Price Changed | $1,799,000 | -2.7% | $339 / Sq Ft |
| 05/13/2017 05/13/17 | For Sale | $1,849,000 | +208.2% | $349 / Sq Ft |
| 02/14/2017 02/14/17 | Sold | $600,000 | -10.3% | $312 / Sq Ft |
| 07/20/2016 07/20/16 | Pending | -- | -- | -- |
| 05/12/2016 05/12/16 | Price Changed | $669,000 | -2.9% | $348 / Sq Ft |
| 04/11/2016 04/11/16 | Price Changed | $689,000 | -1.4% | $358 / Sq Ft |
| 03/22/2016 03/22/16 | For Sale | $699,000 | -- | $363 / Sq Ft |
Source: MLS Property Information Network (MLS PIN)
Tax History Compared to Growth
Tax History
| Year | Tax Paid | Tax Assessment Tax Assessment Total Assessment is a certain percentage of the fair market value that is determined by local assessors to be the total taxable value of land and additions on the property. | Land | Improvement |
|---|---|---|---|---|
| 2025 | $30,861 | $2,911,400 | $826,800 | $2,084,600 |
| 2024 | $27,108 | $2,165,200 | $525,400 | $1,639,800 |
| 2023 | $24,038 | $1,843,400 | $525,400 | $1,318,000 |
| 2022 | $23,117 | $1,729,000 | $483,800 | $1,245,200 |
| 2021 | $20,667 | $1,586,100 | $483,800 | $1,102,300 |
| 2020 | $20,327 | $1,627,500 | $483,800 | $1,143,700 |
| 2019 | $19,261 | $1,554,600 | $441,700 | $1,112,900 |
| 2018 | $13,240 | $1,114,500 | $441,700 | $672,800 |
| 2017 | $6,346 | $533,700 | $378,600 | $155,100 |
| 2016 | $6,539 | $566,600 | $378,600 | $188,000 |
| 2015 | $6,397 | $566,600 | $378,600 | $188,000 |
| 2014 | $5,983 | $514,000 | $332,000 | $182,000 |
Source: Public Records
Agents Affiliated with this Home
-
Jess Wagner
Seller's Agent in 2025
Jess Wagner
Keller Williams Realty Boston Northwest
(978) 828-5699
1 in this area
50 Total Sales
-
Luisa Cestari
Seller's Agent in 2018
Luisa Cestari
Coldwell Banker Realty - Wellesley
(781) 820-3350
1 in this area
47 Total Sales
-
William Concannon
Seller's Agent in 2017
William Concannon
Louise Condon Realty
(617) 347-4933
26 in this area
45 Total Sales
Map
Source: MLS Property Information Network (MLS PIN)
MLS Number: 71975772
APN: NEED-000141-000013
Disclaimer: Certain information contained herein is derived from information provided by parties other than Homes.com. All information provided is deemed reliable, but is not guaranteed to be accurate and should be independently verified.
![]() The property listing data and information, or the Images, set forth herein were provided to MLS Property Information Network, Inc. from third party sources, including sellers, lessors and public records, and were compiled by MLS Property Information Network, Inc. The property listing data and information, and the Images, are for the personal, non-commercial use of consumers having a good faith interest in purchasing or leasing listed properties of the type displayed to them and may not be used for any purpose other than to identify prospective properties which such consumers may have a good faith interest in purchasing or leasing. MLS Property Information Network, Inc. and its subscribers disclaim any and all representations and warranties as to the accuracy of the property listing data and information, or as to the accuracy of any of the Images, set forth herein.
The property listing data and information, or the Images, set forth herein were provided to MLS Property Information Network, Inc. from third party sources, including sellers, lessors and public records, and were compiled by MLS Property Information Network, Inc. The property listing data and information, and the Images, are for the personal, non-commercial use of consumers having a good faith interest in purchasing or leasing listed properties of the type displayed to them and may not be used for any purpose other than to identify prospective properties which such consumers may have a good faith interest in purchasing or leasing. MLS Property Information Network, Inc. and its subscribers disclaim any and all representations and warranties as to the accuracy of the property listing data and information, or as to the accuracy of any of the Images, set forth herein.
Nearby Homes
- 21 Fairview Rd
- 79 Henderson St
- 66 Oakcrest Rd
- 158 Oak St
- 95 Deerfield Rd
- 45 Rivard Rd
- 29 Tolman St
- 343 High Rock St
- 16 Winfield St
- 1473 Great Plain Ave
- 130 Bridle Trail Rd
- 233 Warren St
- 11 Sunrise Terrace
- 326 Rosemary St
- 90 Norfolk St
- 936 Central Ave
- 181 Dedham Ave
- 19 Oakland Ave Unit 19
- 80 N Hill Ave
- 19 Carol Rd