Estimated Value: $830,000 - $919,000
4
Beds
3
Baths
2,645
Sq Ft
$331/Sq Ft
Est. Value
About This Home
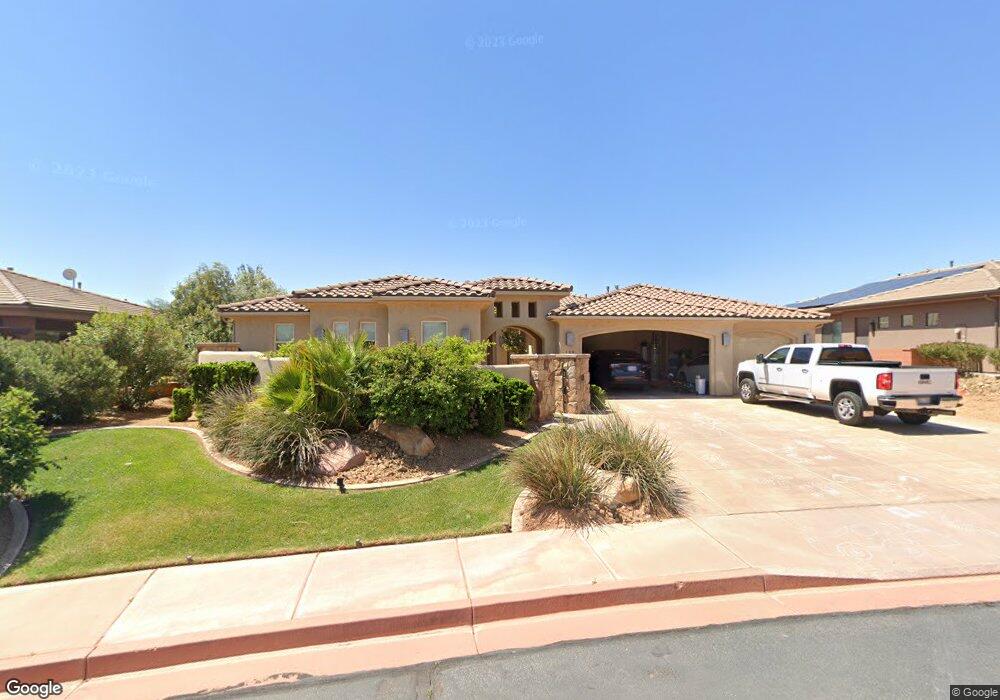
This home is located at 159 N Tenaya Ct, Ivins, UT 84738 and is currently estimated at $874,654, approximately $330 per square foot. 159 N Tenaya Ct is a home located in Washington County with nearby schools including Red Mountain School, Snow Canyon Middle School, and Lava Ridge Intermediate School.
Ownership History
Date
Name
Owned For
Owner Type
Purchase Details
Closed on
May 17, 2022
Sold by
Scott Overson R and Scott Heather L
Bought by
Overson Family Living Trust
Current Estimated Value
Purchase Details
Closed on
May 6, 2022
Sold by
Scott Overson R and Scott Heather L
Bought by
Overson Family Living Trust
Purchase Details
Closed on
Apr 26, 2013
Sold by
Blue Cactus Development Ltd
Bought by
Overson R Scott R and Overson Heather L
Home Financials for this Owner
Home Financials are based on the most recent Mortgage that was taken out on this home.
Original Mortgage
$254,000
Interest Rate
3.6%
Mortgage Type
New Conventional
Purchase Details
Closed on
Apr 5, 2012
Sold by
Vwmw Investments Llc
Bought by
Blue Cactus Development Ltd
Purchase Details
Closed on
Apr 26, 2011
Sold by
Tenaya Sands Llc
Bought by
Vwmw Investments Llc
Create a Home Valuation Report for This Property
The Home Valuation Report is an in-depth analysis detailing your home's value as well as a comparison with similar homes in the area
Purchase History
| Date | Buyer | Sale Price | Title Company |
|---|---|---|---|
| Overson Family Living Trust | -- | -- | |
| Overson Family Living Trust | -- | -- | |
| Overson Family Living Trust | -- | -- | |
| Overson R Scott R | -- | Southern Utah Title | |
| Blue Cactus Development Ltd | -- | Southern Utah Title | |
| Vwmw Investments Llc | -- | None Available |
Source: Public Records
Mortgage History
| Date | Status | Borrower | Loan Amount |
|---|---|---|---|
| Previous Owner | Overson R Scott R | $254,000 |
Source: Public Records
Tax History
| Year | Tax Paid | Tax Assessment Tax Assessment Total Assessment is a certain percentage of the fair market value that is determined by local assessors to be the total taxable value of land and additions on the property. | Land | Improvement |
|---|---|---|---|---|
| 2025 | $2,960 | $444,180 | $123,750 | $320,430 |
| 2023 | $3,153 | $462,000 | $123,750 | $338,250 |
| 2022 | $3,292 | $454,135 | $123,750 | $330,385 |
| 2021 | $3,082 | $631,600 | $150,000 | $481,600 |
| 2020 | $2,786 | $540,300 | $140,000 | $400,300 |
| 2019 | $2,565 | $486,500 | $100,000 | $386,500 |
| 2018 | $2,716 | $265,100 | $0 | $0 |
| 2017 | $2,571 | $244,090 | $0 | $0 |
| 2016 | $2,581 | $226,325 | $0 | $0 |
| 2015 | $2,620 | $221,210 | $0 | $0 |
| 2014 | $2,615 | $221,815 | $0 | $0 |
Source: Public Records
Map
Nearby Homes
- 0 N Tenaya Ct
- Lot #15 N Tenaya Ct
- 147 N Tenaya Ct
- 150 N Arrowhead Ln Unit 9
- 138 N Arrowhead Ln
- 138 N Arrowhead Ln Unit 10
- 160 N Tenaya Ct
- 150 N Arrowhead Ln
- 150 N Arrowhead Ln Unit 9
- 185 N Tenaya Ct
- 126 N Arrowhead Ln
- 176 N Tenaya Ct Unit 19
- Lot 18 Tenaya Sands
- 511 W Tenaya Dr
- 176 N Arrowhead Ln
- 191 N Tenaya Ct
- 191 N Tenaya Ct Unit 21
- 119 N Firerock Trail
- 520 W Tenaya Dr
- 184 N Tenaya Ct
Your Personal Tour Guide
Ask me questions while you tour the home.