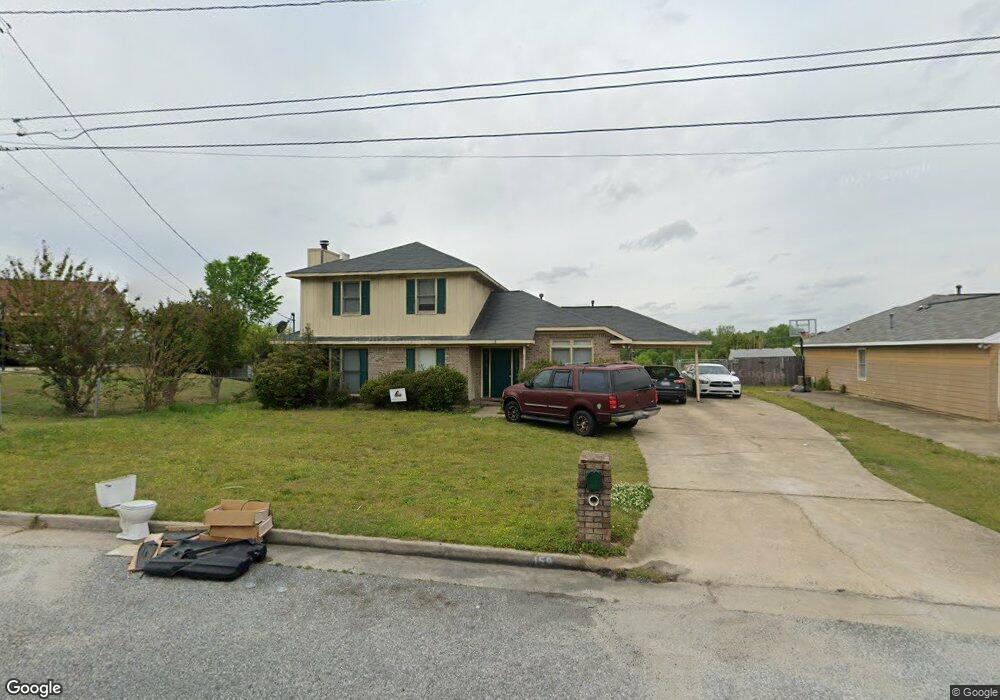
159 Sweetwater Dr Columbus, GA 31907
Eastern Columbus NeighborhoodEstimated Value: $223,000 - $229,654
4
Beds
4
Baths
1,890
Sq Ft
$120/Sq Ft
Est. Value
About This Home
This home is located at 159 Sweetwater Dr, Columbus, GA 31907 and is currently estimated at $226,164, approximately $119 per square foot. 159 Sweetwater Dr is a home located in Muscogee County with nearby schools including Georgetown Elementary School, East Columbus Magnet Academy, and Kendrick High School.
Ownership History
Date
Name
Owned For
Owner Type
Purchase Details
Closed on
Dec 27, 2012
Sold by
Chi Asset Management Llc
Bought by
Mcclinton Tonga B
Current Estimated Value
Home Financials for this Owner
Home Financials are based on the most recent Mortgage that was taken out on this home.
Original Mortgage
$7,500
Outstanding Balance
$5,212
Interest Rate
3.36%
Mortgage Type
New Conventional
Estimated Equity
$220,952
Purchase Details
Closed on
Dec 1, 2010
Sold by
Columbus Housing Initiative Inc
Bought by
Chi Asset Management Llc
Purchase Details
Closed on
Oct 1, 2010
Sold by
Secretary Of Housing & Urban Development
Bought by
Columbus Housing Initiative Inc
Purchase Details
Closed on
Apr 6, 2010
Sold by
Bac Home Loans Servicing Lp
Bought by
Secretary Of Housing & Urban Development
Create a Home Valuation Report for This Property
The Home Valuation Report is an in-depth analysis detailing your home's value as well as a comparison with similar homes in the area
Home Values in the Area
Average Home Value in this Area
Purchase History
| Date | Buyer | Sale Price | Title Company |
|---|---|---|---|
| Mcclinton Tonga B | $123,900 | -- | |
| Chi Asset Management Llc | -- | None Available | |
| Columbus Housing Initiative Inc | -- | None Available | |
| Secretary Of Housing & Urban Development | -- | None Available | |
| Bac Home Loans Servicing Lp | $175,082 | None Available |
Source: Public Records
Mortgage History
| Date | Status | Borrower | Loan Amount |
|---|---|---|---|
| Open | Mcclinton Tonga B | $7,500 | |
| Open | Mcclinton Tonga B | $120,815 |
Source: Public Records
Tax History Compared to Growth
Tax History
| Year | Tax Paid | Tax Assessment Tax Assessment Total Assessment is a certain percentage of the fair market value that is determined by local assessors to be the total taxable value of land and additions on the property. | Land | Improvement |
|---|---|---|---|---|
| 2025 | $1,424 | $83,532 | $12,380 | $71,152 |
| 2024 | $1,423 | $83,532 | $12,380 | $71,152 |
| 2023 | $738 | $83,532 | $12,380 | $71,152 |
| 2022 | $1,484 | $63,028 | $12,380 | $50,648 |
| 2021 | $1,477 | $55,668 | $12,380 | $43,288 |
| 2020 | $1,477 | $55,668 | $12,380 | $43,288 |
| 2019 | $1,484 | $55,668 | $12,380 | $43,288 |
| 2018 | $1,484 | $55,668 | $12,380 | $43,288 |
| 2017 | $1,490 | $55,668 | $12,380 | $43,288 |
| 2016 | $1,497 | $49,560 | $8,752 | $40,808 |
| 2015 | $1,499 | $49,560 | $8,752 | $40,808 |
| 2014 | $1,502 | $49,560 | $8,752 | $40,808 |
| 2013 | -- | $49,560 | $8,752 | $40,808 |
Source: Public Records
Map
Nearby Homes
- 6188 Valencia Dr
- 6223 Georgetown Dr
- 1322 Melford Dr
- 1111 Richland Dr
- 1252 School House Dr
- 6119 Mill Branch Rd
- 6061 Luna Dr
- 6040 Luna Dr
- 1607 Mazor Dr
- 6033 Luna Dr
- 6620 Cove Cir
- 6047 Capri Cir
- 1068 Valencia Dr
- 6213 Fitzgerald Dr
- 6032 Cordova Rd
- 1826 Woodhollow Dr
- 5834 Blueridge Dr
- 5833 Bunche St
- 5828 Georgetown Dr
- 754 Red Oak Dr
- 165 Sweetwater Dr
- 1246 Carmel Dr
- 1250 Carmel Dr
- 6200 Valencia Dr
- 171 Sweetwater Dr
- 6206 Valencia Dr
- 1254 Carmel Dr
- 6194 Valencia Dr
- 6212 Valencia Dr
- 156 Sweetwater Dr
- 162 Sweetwater Dr
- 177 Sweetwater Dr
- 1258 Carmel Dr
- 168 Sweetwater Dr
- 152 Sweetwater Dr
- 6218 Valencia Dr
- 145 Sweetwater Dr
- 1262 Carmel Dr
- 174 Sweetwater Dr
- 183 Sweetwater Dr