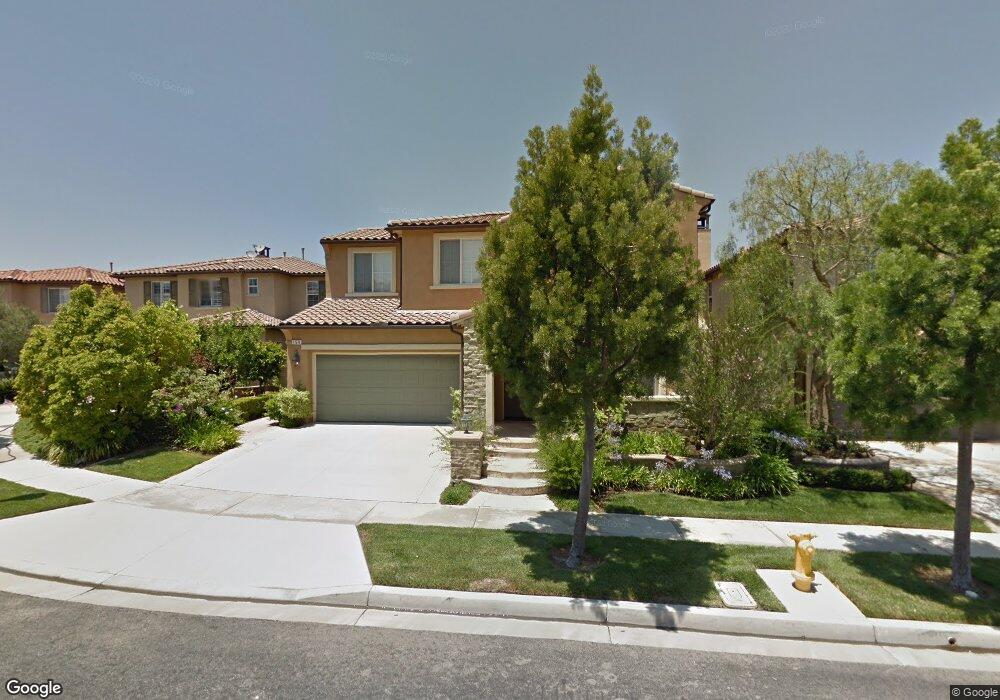
159 Tapestry Irvine, CA 92603
Quail Hill NeighborhoodEstimated Value: $2,358,000 - $3,352,000
5
Beds
5
Baths
2,908
Sq Ft
$1,001/Sq Ft
Est. Value
About This Home
This home is located at 159 Tapestry, Irvine, CA 92603 and is currently estimated at $2,909,637, approximately $1,000 per square foot. 159 Tapestry is a home located in Orange County with nearby schools including Alderwood Elementary, Rancho San Joaquin Middle School, and University High School.
Ownership History
Date
Name
Owned For
Owner Type
Purchase Details
Closed on
Nov 14, 2024
Sold by
Chen Deng-Shan and Chen Shu-Jen L
Bought by
Deng-Shan Chen And Shu-Jen L Chen Family Trus and Chen
Current Estimated Value
Purchase Details
Closed on
Jul 15, 2004
Sold by
Fieldstone Quail Hill Llc
Bought by
Chen Deng Shan and Chen Shu Jen L
Create a Home Valuation Report for This Property
The Home Valuation Report is an in-depth analysis detailing your home's value as well as a comparison with similar homes in the area
Home Values in the Area
Average Home Value in this Area
Purchase History
| Date | Buyer | Sale Price | Title Company |
|---|---|---|---|
| Deng-Shan Chen And Shu-Jen L Chen Family Trus | -- | None Listed On Document | |
| Chen Deng Shan | $1,140,000 | First American Title Co |
Source: Public Records
Tax History
| Year | Tax Paid | Tax Assessment Tax Assessment Total Assessment is a certain percentage of the fair market value that is determined by local assessors to be the total taxable value of land and additions on the property. | Land | Improvement |
|---|---|---|---|---|
| 2025 | $19,001 | $1,591,467 | $1,144,432 | $447,035 |
| 2024 | $19,001 | $1,560,262 | $1,121,992 | $438,270 |
| 2023 | $18,639 | $1,529,669 | $1,099,992 | $429,677 |
| 2022 | $18,284 | $1,499,676 | $1,078,424 | $421,252 |
| 2021 | $17,989 | $1,470,271 | $1,057,278 | $412,993 |
| 2020 | $17,815 | $1,455,196 | $1,046,437 | $408,759 |
| 2019 | $17,507 | $1,426,663 | $1,025,918 | $400,745 |
| 2018 | $17,200 | $1,398,690 | $1,005,802 | $392,888 |
| 2017 | $16,889 | $1,371,265 | $986,080 | $385,185 |
| 2016 | $16,591 | $1,344,378 | $966,745 | $377,633 |
| 2015 | $16,293 | $1,324,185 | $952,224 | $371,961 |
| 2014 | $16,269 | $1,298,247 | $933,572 | $364,675 |
Source: Public Records
Map
Nearby Homes
Your Personal Tour Guide
Ask me questions while you tour the home.