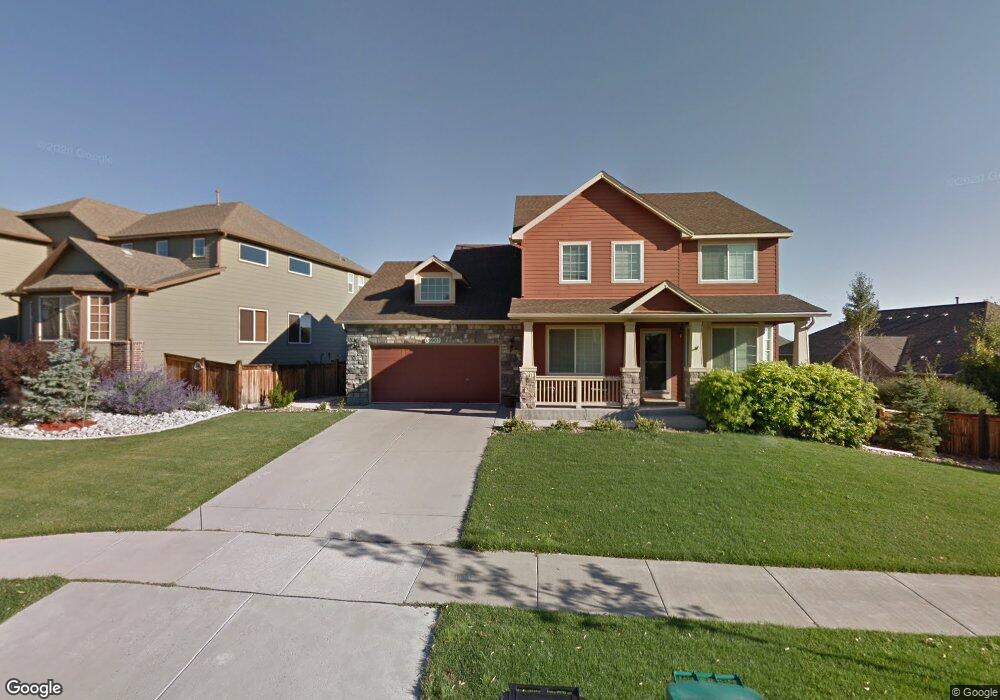
15903 E Flying Quail Ln Parker, CO 80134
Estimated Value: $737,812 - $775,000
4
Beds
3
Baths
3,938
Sq Ft
$191/Sq Ft
Est. Value
About This Home
This home is located at 15903 E Flying Quail Ln, Parker, CO 80134 and is currently estimated at $752,203, approximately $191 per square foot. 15903 E Flying Quail Ln is a home located in Douglas County with nearby schools including Gold Rush Elementary School, Cimarron Middle School, and Legend High School.
Ownership History
Date
Name
Owned For
Owner Type
Purchase Details
Closed on
Oct 1, 2014
Sold by
Steckel Shane A and Steckel Betsy B
Bought by
Cauzza Brad and Cauzza Sarah
Current Estimated Value
Home Financials for this Owner
Home Financials are based on the most recent Mortgage that was taken out on this home.
Original Mortgage
$334,400
Outstanding Balance
$256,366
Interest Rate
4.1%
Mortgage Type
New Conventional
Estimated Equity
$495,837
Purchase Details
Closed on
Apr 24, 2007
Sold by
Melody Homes Inc
Bought by
Steckel Shane A and Steckel Betsy B
Home Financials for this Owner
Home Financials are based on the most recent Mortgage that was taken out on this home.
Original Mortgage
$356,832
Interest Rate
6.13%
Mortgage Type
Unknown
Create a Home Valuation Report for This Property
The Home Valuation Report is an in-depth analysis detailing your home's value as well as a comparison with similar homes in the area
Home Values in the Area
Average Home Value in this Area
Purchase History
| Date | Buyer | Sale Price | Title Company |
|---|---|---|---|
| Cauzza Brad | $418,000 | First American | |
| Steckel Shane A | $356,832 | Land Title Guarantee Company |
Source: Public Records
Mortgage History
| Date | Status | Borrower | Loan Amount |
|---|---|---|---|
| Open | Cauzza Brad | $334,400 | |
| Previous Owner | Steckel Shane A | $356,832 |
Source: Public Records
Tax History Compared to Growth
Tax History
| Year | Tax Paid | Tax Assessment Tax Assessment Total Assessment is a certain percentage of the fair market value that is determined by local assessors to be the total taxable value of land and additions on the property. | Land | Improvement |
|---|---|---|---|---|
| 2024 | $4,908 | $51,880 | $10,920 | $40,960 |
| 2023 | $5,590 | $51,880 | $10,920 | $40,960 |
| 2022 | $3,975 | $35,730 | $7,210 | $28,520 |
| 2021 | $4,127 | $35,730 | $7,210 | $28,520 |
| 2020 | $3,851 | $33,920 | $7,780 | $26,140 |
| 2019 | $3,870 | $33,920 | $7,780 | $26,140 |
| 2018 | $3,676 | $31,580 | $7,070 | $24,510 |
| 2017 | $3,467 | $31,580 | $7,070 | $24,510 |
| 2016 | $3,354 | $30,110 | $6,130 | $23,980 |
| 2015 | $3,402 | $30,110 | $6,130 | $23,980 |
| 2014 | $3,221 | $25,430 | $5,970 | $19,460 |
Source: Public Records
Map
Nearby Homes
- 16046 E Flying Quail Ln
- 12223 S Grass River Trail
- 16204 E Swift Fox Place
- 12084 S Great Plain Ct
- 16754 E Black Horn Dr
- 15165 Yellowthroat St
- 15514 E Flower Mound Place
- 11545 S Flower Mound Way
- 16685 Trail Sky Cir
- 16752 Trail Sky Cir
- 5322 Brian Dr
- Whistler Plan at Tanterra - Kestrel at Tanterra
- Skylark Plan at Tanterra - Kestrel at Tanterra
- Raven Plan at Tanterra - Kestrel at Tanterra
- Nightingale Plan at Tanterra - Kestrel at Tanterra
- 12195 Hornbeam St
- 14589 Hagus Place
- 16563 E Auburn Hills Dr
- 11310 Night Heron Dr
- 17300 Bluetrail Ave
- 15885 E Flying Quail Ln
- 12193 S Grass River Trail
- 12189 S Grass River Trail
- 12197 S Grass River Trail
- 15867 E Flying Quail Ln
- 12210 S Eagle Hawk Trail
- 15876 E Beaver Brook Ln
- 15864 E Beaver Brook Ln
- 15849 E Flying Quail Ln
- 12207 S Grass River Trail
- 15842 E Beaver Brook Ln
- 12209 S Eagle Hawk Trail
- 12181 S Grass River Trail
- 16033 E Flying Quail Ln
- 12214 S Eagle Hawk Trail
- 15831 E Flying Quail Ln
- 15840 E Beaver Brook Ln
- 12211 S Grass River Trail
- 12215 S Eagle Hawk Trail
- 12212 S Rock Ridge Trail