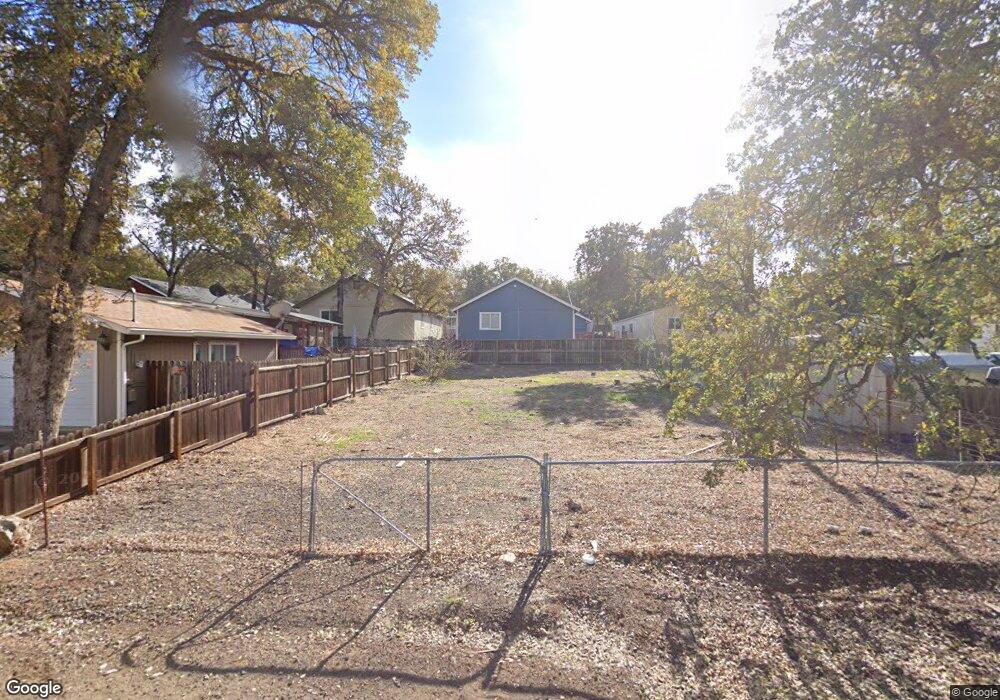
15923 35th Ave Clear Lake, CA 95422
Estimated Value: $51,000 - $61,444
Studio
--
Bath
--
Sq Ft
217,800,000
Sq Ft Lot
About This Home
This home is located at 15923 35th Ave, Clear Lake, CA 95422 and is currently estimated at $56,222. 15923 35th Ave is a home located in Lake County with nearby schools including Lower Lake High School, Jeannies Learning Garden, and Clearlake Seventh-day Adventist Christian School.
Ownership History
Date
Name
Owned For
Owner Type
Purchase Details
Closed on
Jul 30, 2012
Sold by
Finneston Benjamin M
Bought by
Finneston Finneston Benjamin M Benjamin M
Current Estimated Value
Purchase Details
Closed on
Jun 4, 2010
Sold by
Tikkanen Jerry
Bought by
Finneston Benjamin
Home Financials for this Owner
Home Financials are based on the most recent Mortgage that was taken out on this home.
Original Mortgage
$13,000
Interest Rate
5.03%
Mortgage Type
Seller Take Back
Purchase Details
Closed on
Jul 8, 2008
Sold by
Jones Lamar and Jones Christie
Bought by
Tikkanen Jerry
Purchase Details
Closed on
Feb 1, 2006
Sold by
Tikkanen Jerald
Bought by
Jones Lamar and Jones Christie
Home Financials for this Owner
Home Financials are based on the most recent Mortgage that was taken out on this home.
Original Mortgage
$42,500
Interest Rate
6.16%
Mortgage Type
Commercial
Purchase Details
Closed on
Dec 11, 2002
Sold by
Rivera Hernan and Rivera Alba Marina
Bought by
Tikkanen Jerald
Create a Home Valuation Report for This Property
The Home Valuation Report is an in-depth analysis detailing your home's value as well as a comparison with similar homes in the area
Purchase History
| Date | Buyer | Sale Price | Title Company |
|---|---|---|---|
| Finneston Finneston Benjamin M Benjamin M | -- | None Available | |
| Finneston Benjamin | $16,000 | First American Title Company | |
| Tikkanen Jerry | $47,815 | None Available | |
| Jones Lamar | $50,000 | Fidelity National Title | |
| Tikkanen Jerald | $15,000 | Fidelity National Title |
Source: Public Records
Mortgage History
| Date | Status | Borrower | Loan Amount |
|---|---|---|---|
| Previous Owner | Finneston Benjamin | $13,000 | |
| Previous Owner | Jones Lamar | $42,500 |
Source: Public Records
Tax History
| Year | Tax Paid | Tax Assessment Tax Assessment Total Assessment is a certain percentage of the fair market value that is determined by local assessors to be the total taxable value of land and additions on the property. | Land | Improvement |
|---|---|---|---|---|
| 2025 | $358 | $20,635 | $16,770 | $3,865 |
| 2024 | $354 | $20,232 | $16,442 | $3,790 |
| 2023 | $350 | $19,836 | $16,120 | $3,716 |
| 2022 | $428 | $19,448 | $15,804 | $3,644 |
| 2021 | $426 | $19,068 | $15,495 | $3,573 |
| 2020 | $423 | $18,874 | $15,337 | $3,537 |
| 2019 | $411 | $18,505 | $15,037 | $3,468 |
| 2018 | $409 | $18,143 | $14,743 | $3,400 |
| 2017 | $396 | $17,788 | $14,454 | $3,334 |
| 2016 | $326 | $17,440 | $14,171 | $3,269 |
| 2015 | $322 | $17,179 | $13,959 | $3,220 |
| 2014 | $318 | $16,843 | $13,686 | $3,157 |
Source: Public Records
Map
Nearby Homes
- 15953 35th Ave
- 15894 35th Ave
- 15608 36th Ave
- 16129 36th Ave
- 15608 37th Ave
- 15615 37th Ave
- 15814 35th Ave
- 15793 35th Ave
- 15815 37th Ave
- 15614 31st Ave
- 15530 31st Ave
- 3631 Eureka Ave
- 16108 36th Ave
- 16258 35th Ave
- 15604 35th Ave
- 15773 39th Ave
- 15717 38th Ave
- 15903 40th Ave
- 16055 29th Ave
- 16183 33rd Ave
Your Personal Tour Guide
Ask me questions while you tour the home.