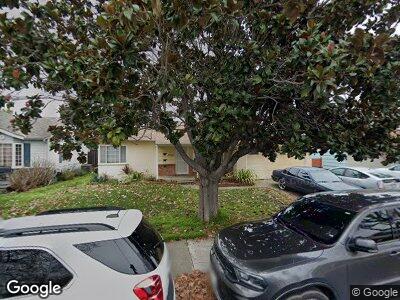
15926 Via Marlin San Lorenzo, CA 94580
Estimated Value: $746,000 - $835,547
3
Beds
1
Bath
1,077
Sq Ft
$751/Sq Ft
Est. Value
About This Home
This home is located at 15926 Via Marlin, San Lorenzo, CA 94580 and is currently estimated at $809,137, approximately $751 per square foot. 15926 Via Marlin is a home located in Alameda County with nearby schools including Grant Elementary School, Washington Manor Middle School, and San Lorenzo High School.
Ownership History
Date
Name
Owned For
Owner Type
Purchase Details
Closed on
Sep 18, 2015
Sold by
Obrien Clifton Teresa and Estate Of Patrick G Obrien
Bought by
Wingate Jerry
Current Estimated Value
Home Financials for this Owner
Home Financials are based on the most recent Mortgage that was taken out on this home.
Original Mortgage
$391,200
Interest Rate
3.9%
Mortgage Type
New Conventional
Purchase Details
Closed on
Mar 27, 2008
Sold by
Dolan Foster Enterprises Llc
Bought by
Roland Miriam J and Gaines Evelyn J
Purchase Details
Closed on
Oct 31, 2007
Sold by
Roland Miriam J and Gaines Evelyn J
Bought by
County Of Alameda
Purchase Details
Closed on
Jun 16, 1998
Sold by
Kinavey Mildred I
Bought by
Kinavey Mildred I and Birch Maureen
Purchase Details
Closed on
Feb 10, 1995
Sold by
Gaines Evelyn J
Bought by
Gaines Evelyn J
Purchase Details
Closed on
Apr 13, 1994
Sold by
Kinavey Deceased Francis J
Bought by
Kinavey Mildred I
Create a Home Valuation Report for This Property
The Home Valuation Report is an in-depth analysis detailing your home's value as well as a comparison with similar homes in the area
Home Values in the Area
Average Home Value in this Area
Purchase History
| Date | Buyer | Sale Price | Title Company |
|---|---|---|---|
| Wingate Jerry | $489,000 | North American Title Co Inc | |
| Roland Miriam J | $10,000 | North American Title Company | |
| County Of Alameda | -- | North American Title Company | |
| Kinavey Mildred I | -- | -- | |
| Gaines Evelyn J | -- | -- |
Source: Public Records
Mortgage History
| Date | Status | Borrower | Loan Amount |
|---|---|---|---|
| Open | Wingate Jerry | $405,000 | |
| Closed | Wingate Jerry | $405,000 | |
| Closed | Wingate Jerry | $391,200 | |
| Previous Owner | Obrien Patrick G | $112,850 |
Source: Public Records
Tax History Compared to Growth
Tax History
| Year | Tax Paid | Tax Assessment Tax Assessment Total Assessment is a certain percentage of the fair market value that is determined by local assessors to be the total taxable value of land and additions on the property. | Land | Improvement |
|---|---|---|---|---|
| 2024 | $7,533 | $567,513 | $170,254 | $397,259 |
| 2023 | $7,495 | $556,388 | $166,916 | $389,472 |
| 2022 | $7,387 | $545,478 | $163,643 | $381,835 |
| 2021 | $7,187 | $534,784 | $160,435 | $374,349 |
| 2020 | $7,035 | $529,303 | $158,791 | $370,512 |
| 2019 | $7,048 | $518,926 | $155,678 | $363,248 |
| 2018 | $6,670 | $508,754 | $152,626 | $356,128 |
| 2017 | $6,365 | $498,780 | $149,634 | $349,146 |
| 2016 | $6,075 | $489,000 | $146,700 | $342,300 |
| 2015 | $3,079 | $234,788 | $65,219 | $169,569 |
| 2014 | $3,033 | $230,188 | $63,941 | $166,247 |
Source: Public Records
Map
Nearby Homes
- 15939 Saint Johns Dr
- 15966 Saint Johns Dr
- 96 Paseo Grande
- 278 Via Mirlo
- 181 E Lewelling Blvd
- 183 E Lewelling Blvd
- 15822 Via Arroyo
- 179 Loma Verde Dr
- 16829 Daryl Ave
- 18289 Meekland Ave
- 591 Via Acalanes
- 15540 Hesperian Blvd
- 295 Hampton Rd
- 16370 Elgin Ct Unit 7
- 920 Elgin St Unit G
- 17303 Via Andeta
- 15928 Mills Ave
- 934 Delano St
- 19235 Times Ave
- 15966 Via Conejo
- 15926 Via Marlin
- 15920 Via Marlin
- 15932 Via Marlin
- 15927 Via Cordoba
- 15921 Via Cordoba
- 15933 Via Cordoba
- 15914 Via Marlin
- 15938 Via Marlin
- 15923 Via Marlin
- 15915 Via Cordoba
- 15929 Via Marlin
- 15939 Via Cordoba
- 15917 Via Marlin
- 15908 Via Marlin
- 15944 Via Marlin
- 15935 Via Marlin
- 15911 Via Marlin
- 15909 Via Cordoba
- 15945 Via Cordoba
- 15941 Via Marlin