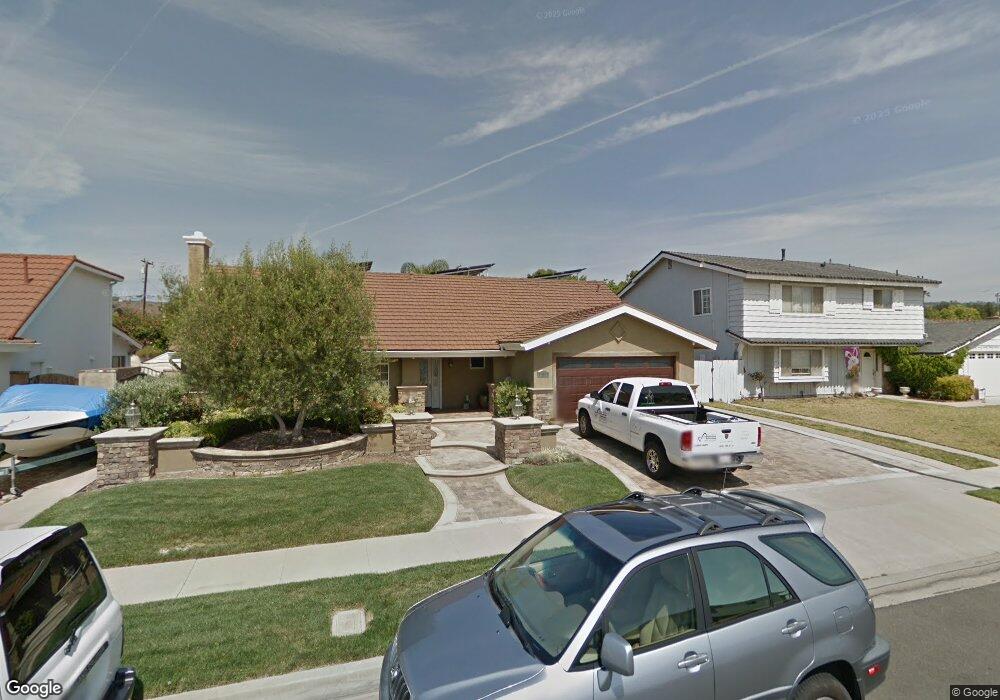
1593 Euclid Ave Camarillo, CA 93010
Estimated Value: $966,000 - $1,079,971
4
Beds
3
Baths
2,340
Sq Ft
$432/Sq Ft
Est. Value
About This Home
This home is located at 1593 Euclid Ave, Camarillo, CA 93010 and is currently estimated at $1,010,743, approximately $431 per square foot. 1593 Euclid Ave is a home located in Ventura County with nearby schools including Dos Caminos Elementary School, Monte Vista Middle School, and Adolfo Camarillo High School.
Ownership History
Date
Name
Owned For
Owner Type
Purchase Details
Closed on
Mar 6, 2009
Sold by
Mccann Jeffery and Mccann Pamela Kay
Bought by
Byerly Chad M and Byerly Edna
Current Estimated Value
Home Financials for this Owner
Home Financials are based on the most recent Mortgage that was taken out on this home.
Original Mortgage
$340,000
Interest Rate
5.02%
Mortgage Type
Purchase Money Mortgage
Purchase Details
Closed on
Mar 18, 2003
Sold by
Taylor Thomas A and Taylor Carolyn
Bought by
Mccann Jeffery and Mccann Pamela Kay
Home Financials for this Owner
Home Financials are based on the most recent Mortgage that was taken out on this home.
Original Mortgage
$365,500
Interest Rate
5.71%
Mortgage Type
Purchase Money Mortgage
Purchase Details
Closed on
May 14, 1998
Sold by
Taylor Thomas A
Bought by
Taylor Thomas A and Taylor Carolyn
Create a Home Valuation Report for This Property
The Home Valuation Report is an in-depth analysis detailing your home's value as well as a comparison with similar homes in the area
Home Values in the Area
Average Home Value in this Area
Purchase History
| Date | Buyer | Sale Price | Title Company |
|---|---|---|---|
| Byerly Chad M | $425,000 | First American Title Company | |
| Mccann Jeffery | $457,000 | First American Title Ins Co | |
| Taylor Thomas A | -- | -- |
Source: Public Records
Mortgage History
| Date | Status | Borrower | Loan Amount |
|---|---|---|---|
| Previous Owner | Byerly Chad M | $340,000 | |
| Previous Owner | Mccann Jeffery | $365,500 |
Source: Public Records
Tax History
| Year | Tax Paid | Tax Assessment Tax Assessment Total Assessment is a certain percentage of the fair market value that is determined by local assessors to be the total taxable value of land and additions on the property. | Land | Improvement |
|---|---|---|---|---|
| 2025 | $6,034 | $547,278 | $273,639 | $273,639 |
| 2024 | $6,034 | $536,548 | $268,274 | $268,274 |
| 2023 | $5,819 | $526,028 | $263,014 | $263,014 |
| 2022 | $5,802 | $515,714 | $257,857 | $257,857 |
| 2021 | $5,594 | $505,602 | $252,801 | $252,801 |
| 2020 | $5,574 | $500,420 | $250,210 | $250,210 |
| 2019 | $5,549 | $490,608 | $245,304 | $245,304 |
| 2018 | $5,447 | $480,990 | $240,495 | $240,495 |
| 2017 | $5,127 | $471,560 | $235,780 | $235,780 |
| 2016 | $5,005 | $462,314 | $231,157 | $231,157 |
| 2015 | $4,953 | $455,372 | $227,686 | $227,686 |
| 2014 | $4,838 | $446,454 | $223,227 | $223,227 |
Source: Public Records
Map
Nearby Homes
- 1709 Las Posas Rd
- 1387 Lantana St
- 157 Lantana St
- 1492 Mandalay Ct
- 2052 Glenbrook Ave
- 342 Gardenia Ave
- 1016 Camino Vera Cruz
- 939 Calabria Ct
- 2103 Euclid Ave
- 1487 Nordman Dr
- 942 Euclid Ave
- 78 W Loop Dr
- 1944 Hayden St
- 1075 Seybolt Ave
- 2174 Wilcox St
- 1682 Darnell Ct
- 1623 Regent St
- 2436 Kimberly Ave
- 1490 Calle la Cumbre
- 1143 Bordeaux Ave
- 1601 Euclid Ave
- 1577 Euclid Ave
- 1551 Euclid Ave
- 1609 Euclid Ave
- 1590 Euclid Ave
- 1600 Euclid Ave
- 1572 Euclid Ave
- 1631 Euclid Ave
- 1545 Euclid Ave
- 1608 Euclid Ave
- 1518 Lyndhurst Ave
- 1550 Euclid Ave
- 1546 Lyndhurst Ave
- 1506 Lyndhurst Ave
- 1558 Lyndhurst Ave
- 1630 Euclid Ave
- 1653 Euclid Ave
- 1542 Euclid Ave
- 1591 Royce Ct
- 1599 Royce Ct
Your Personal Tour Guide
Ask me questions while you tour the home.