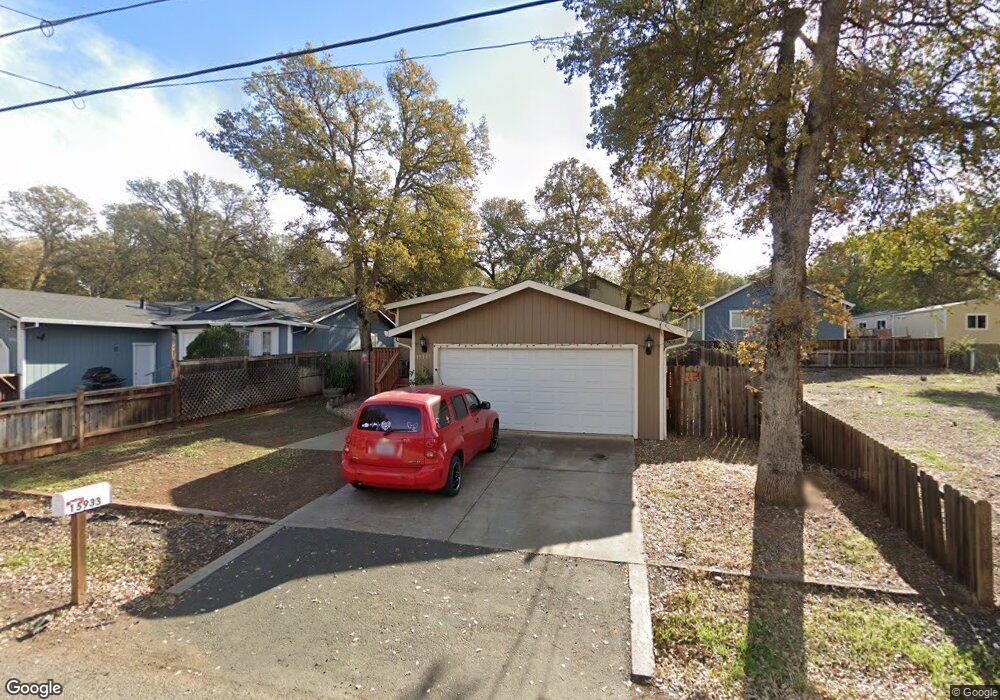
15933 35th Ave Clearlake, CA 95422
Estimated Value: $137,000
2
Beds
2
Baths
1,025
Sq Ft
$134/Sq Ft
Est. Value
About This Home
This home is located at 15933 35th Ave, Clearlake, CA 95422 and is currently estimated at $137,000, approximately $133 per square foot. 15933 35th Ave is a home located in Lake County with nearby schools including Lower Lake High School, Jeannies Learning Garden, and Clearlake Seventh-day Adventist Christian School.
Ownership History
Date
Name
Owned For
Owner Type
Purchase Details
Closed on
Dec 19, 2018
Sold by
Mckinnie Brian
Bought by
Denno Shelleen
Current Estimated Value
Purchase Details
Closed on
Oct 29, 2018
Sold by
Denno Shelleen
Bought by
Denno Shelleen E
Purchase Details
Closed on
Oct 12, 2006
Sold by
Haverty James P and Morey William E
Bought by
Mckinnie Brian and Denno Clyde
Create a Home Valuation Report for This Property
The Home Valuation Report is an in-depth analysis detailing your home's value as well as a comparison with similar homes in the area
Purchase History
| Date | Buyer | Sale Price | Title Company |
|---|---|---|---|
| Denno Shelleen | -- | None Available | |
| Denno Shelleen E | -- | None Available | |
| Mckinnie Brian | $70,000 | Fidelity Natl Title Co Of Ca | |
| Haverty James P | -- | Fidelity Natl Title Co Of Ca |
Source: Public Records
Tax History
| Year | Tax Paid | Tax Assessment Tax Assessment Total Assessment is a certain percentage of the fair market value that is determined by local assessors to be the total taxable value of land and additions on the property. | Land | Improvement |
|---|---|---|---|---|
| 2025 | $1,647 | $132,875 | $40,086 | $92,789 |
| 2024 | $1,627 | $130,270 | $39,300 | $90,970 |
| 2023 | $1,606 | $127,717 | $38,530 | $89,187 |
| 2022 | $1,525 | $125,214 | $37,775 | $87,439 |
| 2021 | $1,560 | $122,760 | $37,035 | $85,725 |
| 2020 | $1,551 | $121,502 | $36,656 | $84,846 |
| 2019 | $911 | $68,575 | $22,750 | $45,825 |
| 2018 | $926 | $68,575 | $22,750 | $45,825 |
| 2017 | $899 | $68,575 | $22,750 | $45,825 |
| 2016 | $818 | $68,575 | $22,750 | $45,825 |
| 2015 | $816 | $68,575 | $22,750 | $45,825 |
| 2014 | $815 | $68,575 | $22,750 | $45,825 |
Source: Public Records
Map
Nearby Homes
- 15953 35th Ave
- 15976 33rd Ave
- 15894 35th Ave
- 15608 36th Ave
- 16129 36th Ave
- 15583 33rd Ave
- 15608 37th Ave
- 15615 37th Ave
- 15814 35th Ave
- 15815 37th Ave
- 15793 35th Ave
- 15614 31st Ave
- 16108 36th Ave
- 16258 35th Ave
- 15604 35th Ave
- 16064 31st Ave
- 15773 39th Ave
- 3631 Eureka Ave
- 16053 31st Ave
- 15903 40th Ave
Your Personal Tour Guide
Ask me questions while you tour the home.