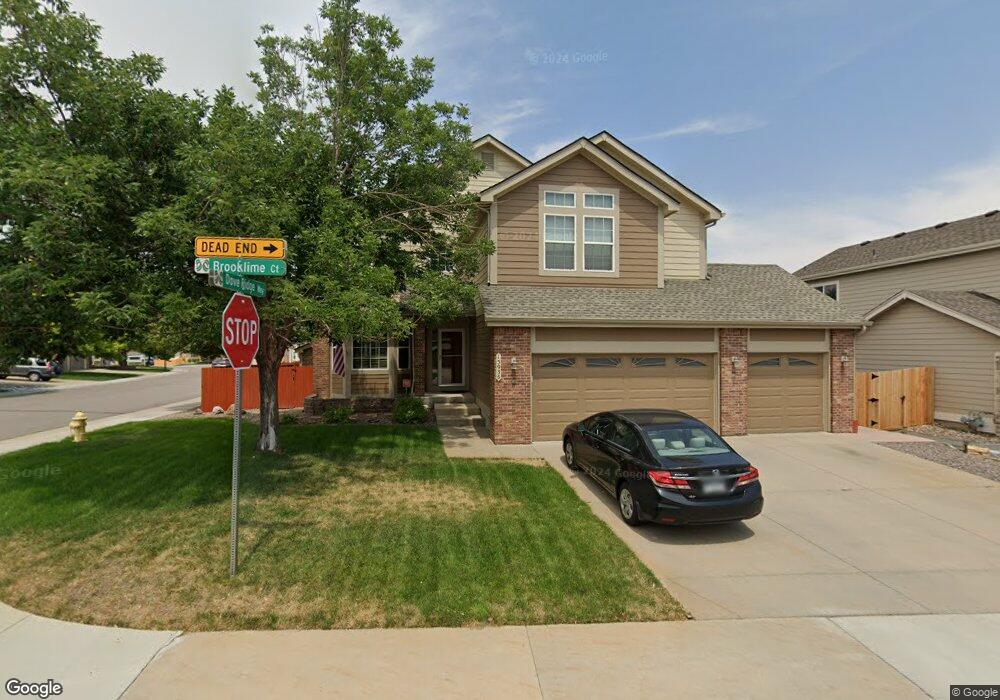
15935 Brooklime Ct Parker, CO 80134
Cottonwood NeighborhoodEstimated Value: $617,926 - $737,000
4
Beds
3
Baths
2,221
Sq Ft
$296/Sq Ft
Est. Value
About This Home
This home is located at 15935 Brooklime Ct, Parker, CO 80134 and is currently estimated at $656,732, approximately $295 per square foot. 15935 Brooklime Ct is a home located in Douglas County with nearby schools including Pine Lane Elementary School, Sierra Middle School, and Chaparral High School.
Ownership History
Date
Name
Owned For
Owner Type
Purchase Details
Closed on
Mar 13, 2014
Sold by
Gale Bradley R
Bought by
Kent Patricia A
Current Estimated Value
Home Financials for this Owner
Home Financials are based on the most recent Mortgage that was taken out on this home.
Original Mortgage
$315,425
Interest Rate
3.75%
Mortgage Type
FHA
Purchase Details
Closed on
Feb 13, 2004
Sold by
Kent Patricia A
Bought by
Kent Patricia A and Gale Bradley R
Home Financials for this Owner
Home Financials are based on the most recent Mortgage that was taken out on this home.
Original Mortgage
$219,790
Interest Rate
5.5%
Mortgage Type
New Conventional
Purchase Details
Closed on
Dec 17, 2003
Sold by
Us Home Corp
Bought by
Kent Patricia A
Home Financials for this Owner
Home Financials are based on the most recent Mortgage that was taken out on this home.
Original Mortgage
$219,790
Interest Rate
5.5%
Mortgage Type
New Conventional
Purchase Details
Closed on
Aug 4, 2000
Sold by
470 Compark Llc
Bought by
Dove Ridge Two Llc
Create a Home Valuation Report for This Property
The Home Valuation Report is an in-depth analysis detailing your home's value as well as a comparison with similar homes in the area
Home Values in the Area
Average Home Value in this Area
Purchase History
| Date | Buyer | Sale Price | Title Company |
|---|---|---|---|
| Kent Patricia A | -- | None Available | |
| Kent Patricia A | -- | Landmark Title | |
| Kent Patricia A | $274,766 | North American Title | |
| Dove Ridge Two Llc | $980,200 | -- |
Source: Public Records
Mortgage History
| Date | Status | Borrower | Loan Amount |
|---|---|---|---|
| Previous Owner | Kent Patricia A | $315,425 | |
| Previous Owner | Kent Patricia A | $219,790 | |
| Previous Owner | Kent Patricia A | $261,000 | |
| Closed | Kent Patricia A | $41,210 |
Source: Public Records
Tax History
| Year | Tax Paid | Tax Assessment Tax Assessment Total Assessment is a certain percentage of the fair market value that is determined by local assessors to be the total taxable value of land and additions on the property. | Land | Improvement |
|---|---|---|---|---|
| 2025 | $3,370 | $35,430 | $9,860 | $25,570 |
| 2024 | $3,370 | $44,050 | $9,090 | $34,960 |
| 2023 | $3,407 | $44,050 | $9,090 | $34,960 |
| 2022 | $2,549 | $31,600 | $6,190 | $25,410 |
| 2021 | $2,654 | $31,600 | $6,190 | $25,410 |
| 2020 | $2,560 | $31,210 | $7,690 | $23,520 |
| 2019 | $2,570 | $31,210 | $7,690 | $23,520 |
| 2018 | $2,286 | $27,290 | $6,930 | $20,360 |
| 2017 | $3,496 | $27,290 | $6,930 | $20,360 |
| 2016 | $3,077 | $24,630 | $5,860 | $18,770 |
| 2015 | $3,127 | $24,630 | $5,860 | $18,770 |
| 2014 | $2,960 | $21,670 | $5,580 | $16,090 |
Source: Public Records
Map
Nearby Homes
- 16049 Brooklime Ct
- 8453 Bed Straw St
- 8472 Bluegrass Cir
- 16024 Butterwort Cir
- 8470 Canyon Rim Trail Unit 1
- 16321 Orchard Grass Ln
- 8660 Bluegrass Cir
- 15540 Canyon Gulch Ln Unit 210
- 15470 Canyon Rim Dr Unit 205
- 15455 Canyon Rim Dr Unit 103
- 8467 Canyon Rim Cir Unit 302
- 8467 Canyon Rim Cir Unit 303
- 8741 Ginkgo Loop
- 8489 Canyon Rim Cir Unit 207
- 8471 Wild Alfalfa Place
- 15937 E Otero Cir
- 16348 E Phillips Ln
- 8524 Wheatgrass Cir
- 16655 Ninebark Way
- 8439 Sandreed Cir
- 8500 Black Gum St
- 8500 Blackgum St
- 15979 Brooklime Ct
- 8541 Dove Ridge Way
- 15934 Brooklime Ct
- 8490 Blackgum St
- 8490 Black Gum St
- 8549 Dove Ridge Way
- 8535 Dove Ridge Way
- 15954 Brooklime Ct
- 8482 Black Gum St
- 8559 Dove Ridge Way
- 16001 Brooklime Ct
- 15974 Brooklime Ct
- 8474 Black Gum St
- 15852 Butterwort Cir
- 8464 Black Gum St
- 8565 Dove Ridge Way
- 8464 Blackgum St
- 15994 Brooklime Ct
Your Personal Tour Guide
Ask me questions while you tour the home.