15948 Flotilla Trail Unit 336 Saint Paul, MN 55124
Galaxie Commons NeighborhoodEstimated Value: $248,650 - $260,000
2
Beds
2
Baths
1,260
Sq Ft
$203/Sq Ft
Est. Value
About This Home
This home is located at 15948 Flotilla Trail Unit 336, Saint Paul, MN 55124 and is currently estimated at $255,413, approximately $202 per square foot. 15948 Flotilla Trail Unit 336 is a home located in Dakota County with nearby schools including Parkview Elementary School, Scott Highlands Middle School, and Rosemount Senior High School.
Ownership History
Date
Name
Owned For
Owner Type
Purchase Details
Closed on
Oct 7, 2022
Sold by
Habiba Mohamed and Ibrahim Sherehan
Bought by
Moore Terron
Current Estimated Value
Home Financials for this Owner
Home Financials are based on the most recent Mortgage that was taken out on this home.
Original Mortgage
$180,000
Outstanding Balance
$172,603
Interest Rate
5.55%
Mortgage Type
New Conventional
Estimated Equity
$82,810
Purchase Details
Closed on
Apr 29, 2016
Sold by
Pratama Anton Sunarko and Miranda Cicilia
Bought by
Habiba Mohamed
Home Financials for this Owner
Home Financials are based on the most recent Mortgage that was taken out on this home.
Original Mortgage
$157,900
Interest Rate
3.73%
Mortgage Type
VA
Purchase Details
Closed on
Oct 27, 2003
Sold by
Palmer David J and Palmer Kelly Jo
Bought by
Pratama Anton Sunarko
Purchase Details
Closed on
Jun 29, 2001
Sold by
Pulte Homes Of Minnesota Corp
Bought by
Palmer David J and Palmer Kelly Jo
Create a Home Valuation Report for This Property
The Home Valuation Report is an in-depth analysis detailing your home's value as well as a comparison with similar homes in the area
Home Values in the Area
Average Home Value in this Area
Purchase History
| Date | Buyer | Sale Price | Title Company |
|---|---|---|---|
| Moore Terron | $240,000 | -- | |
| Habiba Mohamed | $157,900 | Global Closing & Title Svcs | |
| Pratama Anton Sunarko | $169,900 | -- | |
| Palmer David J | $134,775 | -- |
Source: Public Records
Mortgage History
| Date | Status | Borrower | Loan Amount |
|---|---|---|---|
| Open | Moore Terron | $180,000 | |
| Previous Owner | Habiba Mohamed | $157,900 |
Source: Public Records
Tax History Compared to Growth
Tax History
| Year | Tax Paid | Tax Assessment Tax Assessment Total Assessment is a certain percentage of the fair market value that is determined by local assessors to be the total taxable value of land and additions on the property. | Land | Improvement |
|---|---|---|---|---|
| 2024 | $2,688 | $245,900 | $54,300 | $191,600 |
| 2023 | $2,688 | $236,800 | $53,100 | $183,700 |
| 2022 | $2,178 | $233,100 | $53,000 | $180,100 |
| 2021 | $2,026 | $200,900 | $46,300 | $154,600 |
| 2020 | $2,056 | $184,800 | $44,100 | $140,700 |
| 2019 | $1,778 | $182,100 | $42,000 | $140,100 |
| 2018 | $1,675 | $167,900 | $38,900 | $129,000 |
| 2017 | $1,716 | $153,900 | $36,000 | $117,900 |
| 2016 | $1,628 | $150,300 | $34,300 | $116,000 |
| 2015 | $1,436 | $118,303 | $27,856 | $90,447 |
| 2014 | -- | $104,460 | $24,910 | $79,550 |
| 2013 | -- | $98,247 | $22,052 | $76,195 |
Source: Public Records
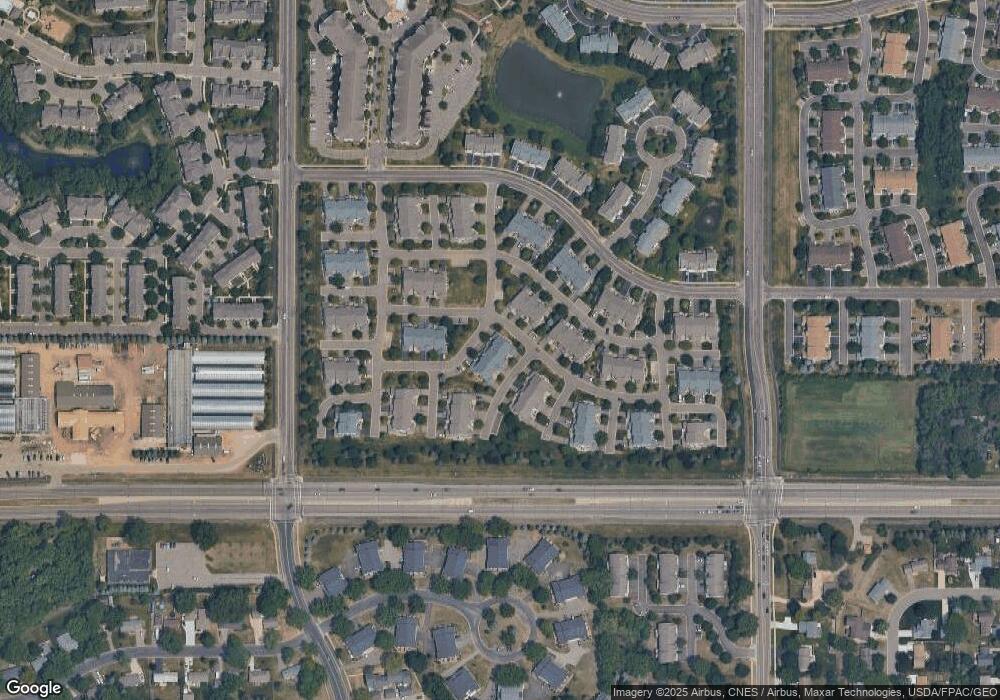
Map
Nearby Homes
- 15973 Flotilla Trail Unit 300
- 15792 Flan Ct
- 6744 Foliage Ct W
- 6414 158th St W Unit 201
- 6760 158th St W
- 16123 Flagstaff Ct N
- 6406 157th St W
- 6456 157th St W
- 15681 Flackwood Way
- 15725 France Way Unit 1416
- 6852 161st St W
- 15675 Flackwood Way
- 6634 162nd Ct Unit 421
- 15823 Freedom Ln
- 15854 Frisian Ln
- 6869 Folkestone Rd Unit 614
- 15822 Frisian Ln
- 15649 Flackwood Way
- 15682 Fjord Ave
- 15521 Foghorn Ln
- 15963 Flotilla Trail Unit 306
- 15861 Fleet Trail Unit 340
- 15859 Fleet Trail Unit 339
- 15857 Fleet Trail
- 15855 Fleet Trail
- 15950 Flotilla Trail Unit 335
- 15952 Flotilla Trail
- 15954 Flotilla Trail
- 15963 Flotilla Trail
- 15965 Flotilla Trail Unit 305
- 15967 Flotilla Trail Unit 304
- 15969 Flotilla Trail Unit 303
- 15977 Flotilla Trail
- 15975 Flotilla Trail
- 15971 Flotilla Trail
- 15919 Flute Way
- 15917 Flute Way
- 15915 Flute Way Unit 288
- 15937 Flotilla Trail
- 15935 Flotilla Trail