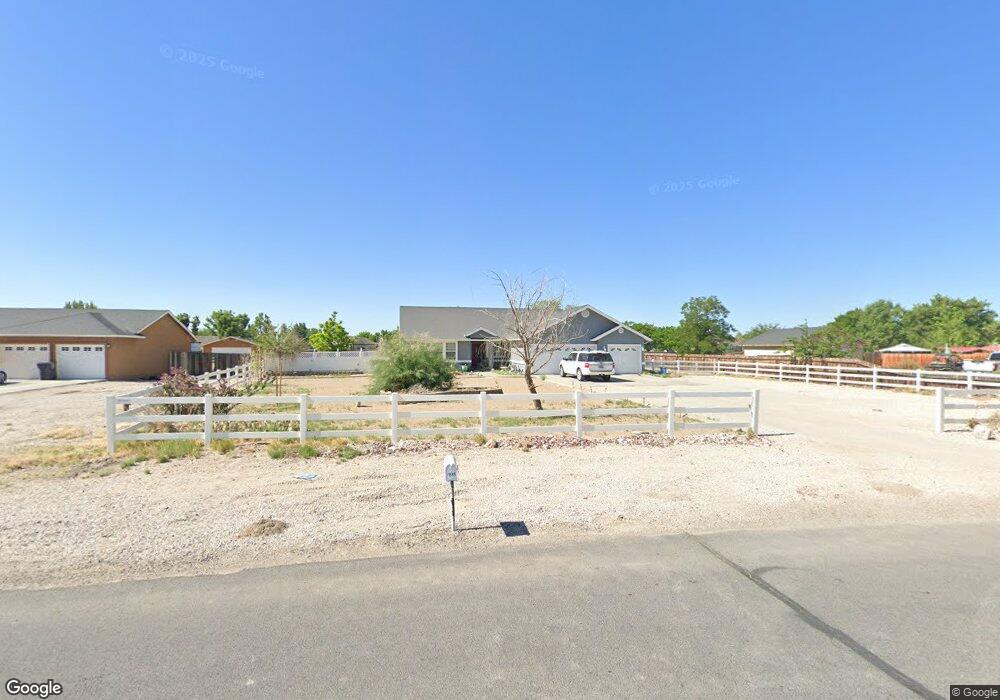
1595 Golden Park Way Fallon, NV 89406
Estimated Value: $402,000 - $472,535
3
Beds
2
Baths
1,684
Sq Ft
$265/Sq Ft
Est. Value
About This Home
This home is located at 1595 Golden Park Way, Fallon, NV 89406 and is currently estimated at $446,384, approximately $265 per square foot. 1595 Golden Park Way is a home located in Churchill County with nearby schools including Lahontan Elementary School, E.C. Best Elementary School, and Numa Elementary School.
Ownership History
Date
Name
Owned For
Owner Type
Purchase Details
Closed on
May 19, 2010
Sold by
Federal National Mortgage Association
Bought by
Johnson Robert Arnold and Johnson Hazel J
Current Estimated Value
Home Financials for this Owner
Home Financials are based on the most recent Mortgage that was taken out on this home.
Original Mortgage
$130,054
Outstanding Balance
$87,085
Interest Rate
5.03%
Mortgage Type
VA
Estimated Equity
$359,299
Purchase Details
Closed on
Sep 22, 2009
Sold by
Biddinger Matthew and Biddinger Kenia
Bought by
Federal National Mortgage Association
Purchase Details
Closed on
Jun 29, 2005
Sold by
Biddinger Properties Llc
Bought by
Biddinger Matthew and Biddinger Kenia
Home Financials for this Owner
Home Financials are based on the most recent Mortgage that was taken out on this home.
Original Mortgage
$170,800
Interest Rate
5.58%
Mortgage Type
New Conventional
Create a Home Valuation Report for This Property
The Home Valuation Report is an in-depth analysis detailing your home's value as well as a comparison with similar homes in the area
Home Values in the Area
Average Home Value in this Area
Purchase History
| Date | Buyer | Sale Price | Title Company |
|---|---|---|---|
| Johnson Robert Arnold | $125,900 | Western Nevada Title Company | |
| Federal National Mortgage Association | $182,379 | Fidelity Natl Title Ins Co | |
| Biddinger Matthew | $218,000 | Stewart Title Company |
Source: Public Records
Mortgage History
| Date | Status | Borrower | Loan Amount |
|---|---|---|---|
| Open | Johnson Robert Arnold | $130,054 | |
| Previous Owner | Biddinger Matthew | $170,800 |
Source: Public Records
Tax History Compared to Growth
Tax History
| Year | Tax Paid | Tax Assessment Tax Assessment Total Assessment is a certain percentage of the fair market value that is determined by local assessors to be the total taxable value of land and additions on the property. | Land | Improvement |
|---|---|---|---|---|
| 2025 | $2,584 | $99,332 | $22,750 | $76,582 |
| 2024 | $2,584 | $100,590 | $22,750 | $77,840 |
| 2023 | $2,584 | $95,390 | $22,750 | $72,640 |
| 2022 | $2,214 | $77,049 | $14,000 | $63,049 |
| 2021 | $2,168 | $75,425 | $14,000 | $61,425 |
| 2020 | $2,090 | $76,254 | $14,000 | $62,254 |
| 2019 | $2,018 | $74,663 | $14,000 | $60,663 |
| 2018 | $1,926 | $72,907 | $14,000 | $58,907 |
| 2017 | $1,870 | $70,540 | $11,375 | $59,165 |
| 2016 | $1,823 | $63,741 | $11,375 | $52,366 |
| 2015 | $1,687 | $60,650 | $11,375 | $49,275 |
| 2014 | $1,647 | $56,516 | $11,288 | $45,228 |
Source: Public Records
Map
Nearby Homes
- 1415 Golden Park Way
- 696 Sunrise Terrace
- 505 Hunter Park Way
- 1480 River View Dr
- 215 Hunter Park Way
- 815 Great Basin Ln
- 775 Karry Way
- 882 Great Basin Ln
- 641 Megan Way
- 738 Noel Ln
- 714 Noel Ln
- 1004 Conifer Dr
- 365 Kathy St Unit 3
- 1125 Alder Dr
- 654 Sycamore Dr
- 410 Heron Ln
- 411 Heron Ln
- 1755 Coleman Rd
- 550 Wade Ln
- 604 Serpa Place
- 1565 Golden Park Way
- 1625 Golden Park Way
- 1130 Venturacci Ln
- 1535 Golden Park Way
- 1100 Venturacci Ln
- 1176 Venturacci Ln
- 1610 Golden Park Way
- 1550 Golden Park Way
- 596 Sunrise Terrace
- 1640 Golden Park Way
- 1505 Golden Park Way
- 588 Sunrise Terrace
- 1088 Venturacci Ln
- 1520 Golden Park Way
- 1250 Venturacci Ln
- 1145 Venturacci Ln
- 574 Sunrise Terrace
- 626 Sunrise Terrace
- 1475 Golden Park Way
- 1161 Venturacci Ln